

Question: please answer quick. I will upvote A quality analyst wants to construct a sample mean chart for controling a packnging process. Ho lenows from past
please answer quick. I will upvote 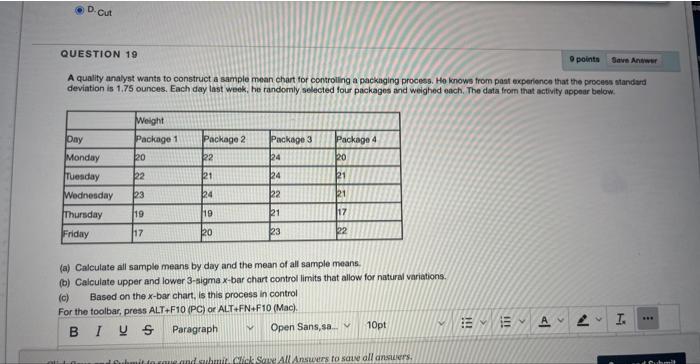
A quality analyst wants to construct a sample mean chart for controling a packnging process. Ho lenows from past experience that the process standerd deviation is 1.75 ounces. Each day last week, he randomly selected four packages and weighed each, The data from that activity appear below. (a) Calculate all sample means by day and the mean of all sample means. (b) Calculate upper and lower 3-sigma x-bar chart control limits that allow for natural variations. (c) Based on the x-bar chart, is this process in control For the toolbar, press ALT+F10 (PC) or ALT+FN+F10 (Mac). B I 5 Step by Step Solution
There are 3 Steps involved in it
1 Expert Approved Answer
Step: 1 Unlock

Question Has Been Solved by an Expert!
Get step-by-step solutions from verified subject matter experts
Step: 2 Unlock
Step: 3 Unlock