

Question: this is my second time posting this question, please actually look at the numbers, averages will be 22, 21, 20.75, 18.5 and 20.5 with a
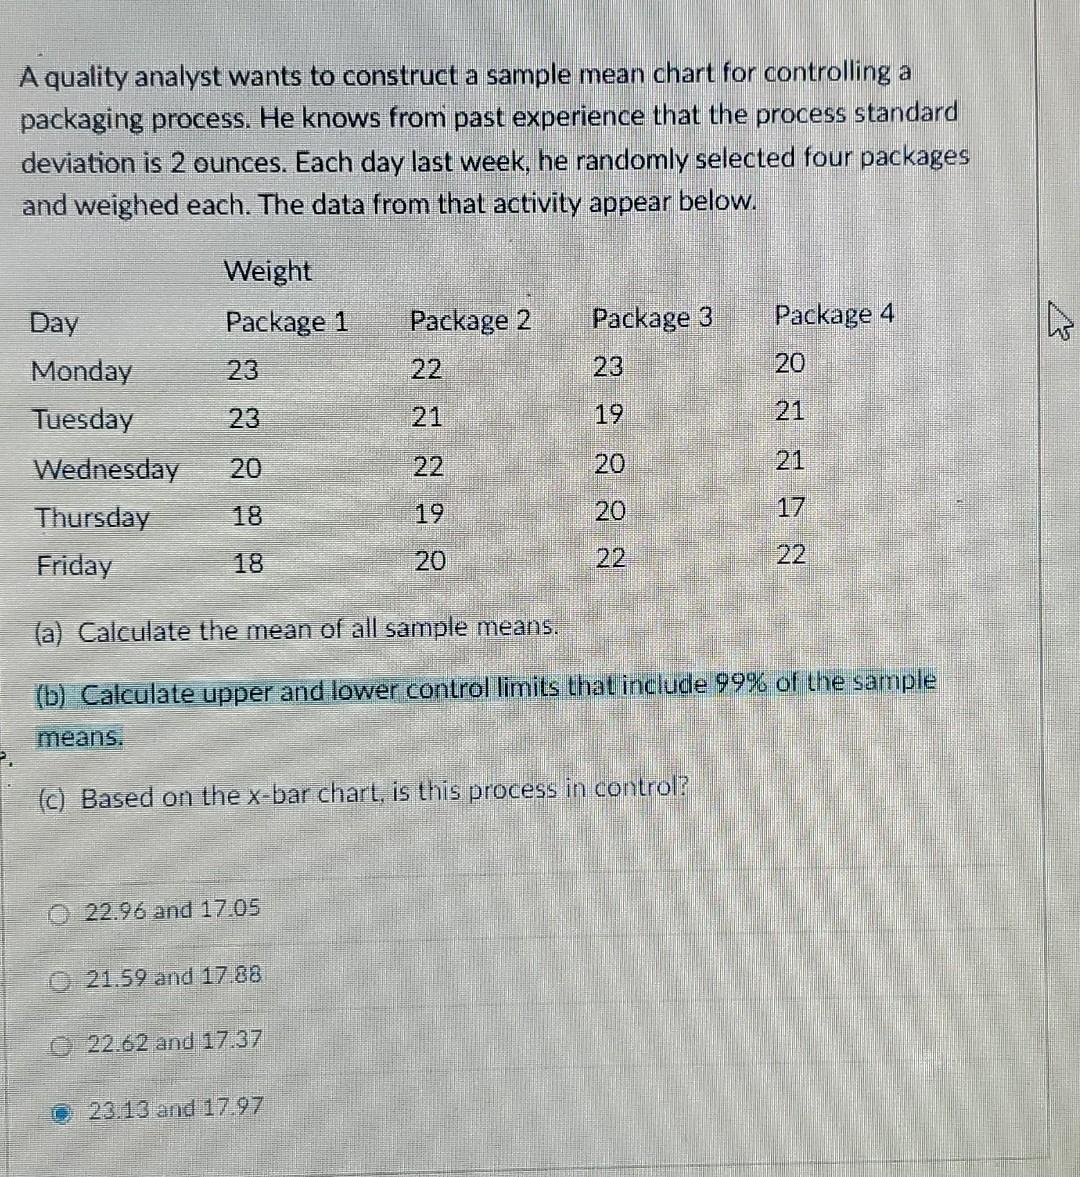
this is my second time posting this question, please actually look at the numbers, averages will be 22, 21, 20.75, 18.5 and 20.5 with a average of averages (x bar bar) of 20.55, possible answers for this question are shown
A quality analyst wants to construct a sample mean chart for controlling a packaging process. He knows from past experience that the process standard deviation is 2 ounces. Each day last week, he randomly selected four packages and weighed each. The data from that activity appear below. Weight Package 1 Package 2 Package 4 12 Package 3 23 23 22 20 23 21 19 21 Day Monday Tuesday Wednesday Thursday Friday 20 22 20 21 18 19 20 18 20 22. 22 (a) Calculate the mean of all sample means. (b) Calculate upper and lower control limits that include 99% of the sample means. (c) Based on the x-bar chart, is this process in control? 22.96 and 1705 o 21.59 and 17 88 o 22.62 and 17.37 23.13 and 17.97Step by Step Solution
There are 3 Steps involved in it
1 Expert Approved Answer
Step: 1 Unlock

Question Has Been Solved by an Expert!
Get step-by-step solutions from verified subject matter experts
Step: 2 Unlock
Step: 3 Unlock