

Question: please answer quickly, thanks!! Question Help The data represents the heights of eruptions by a geyser. Height of eruption (in.) Use the heights to construct
please answer quickly, thanks!!
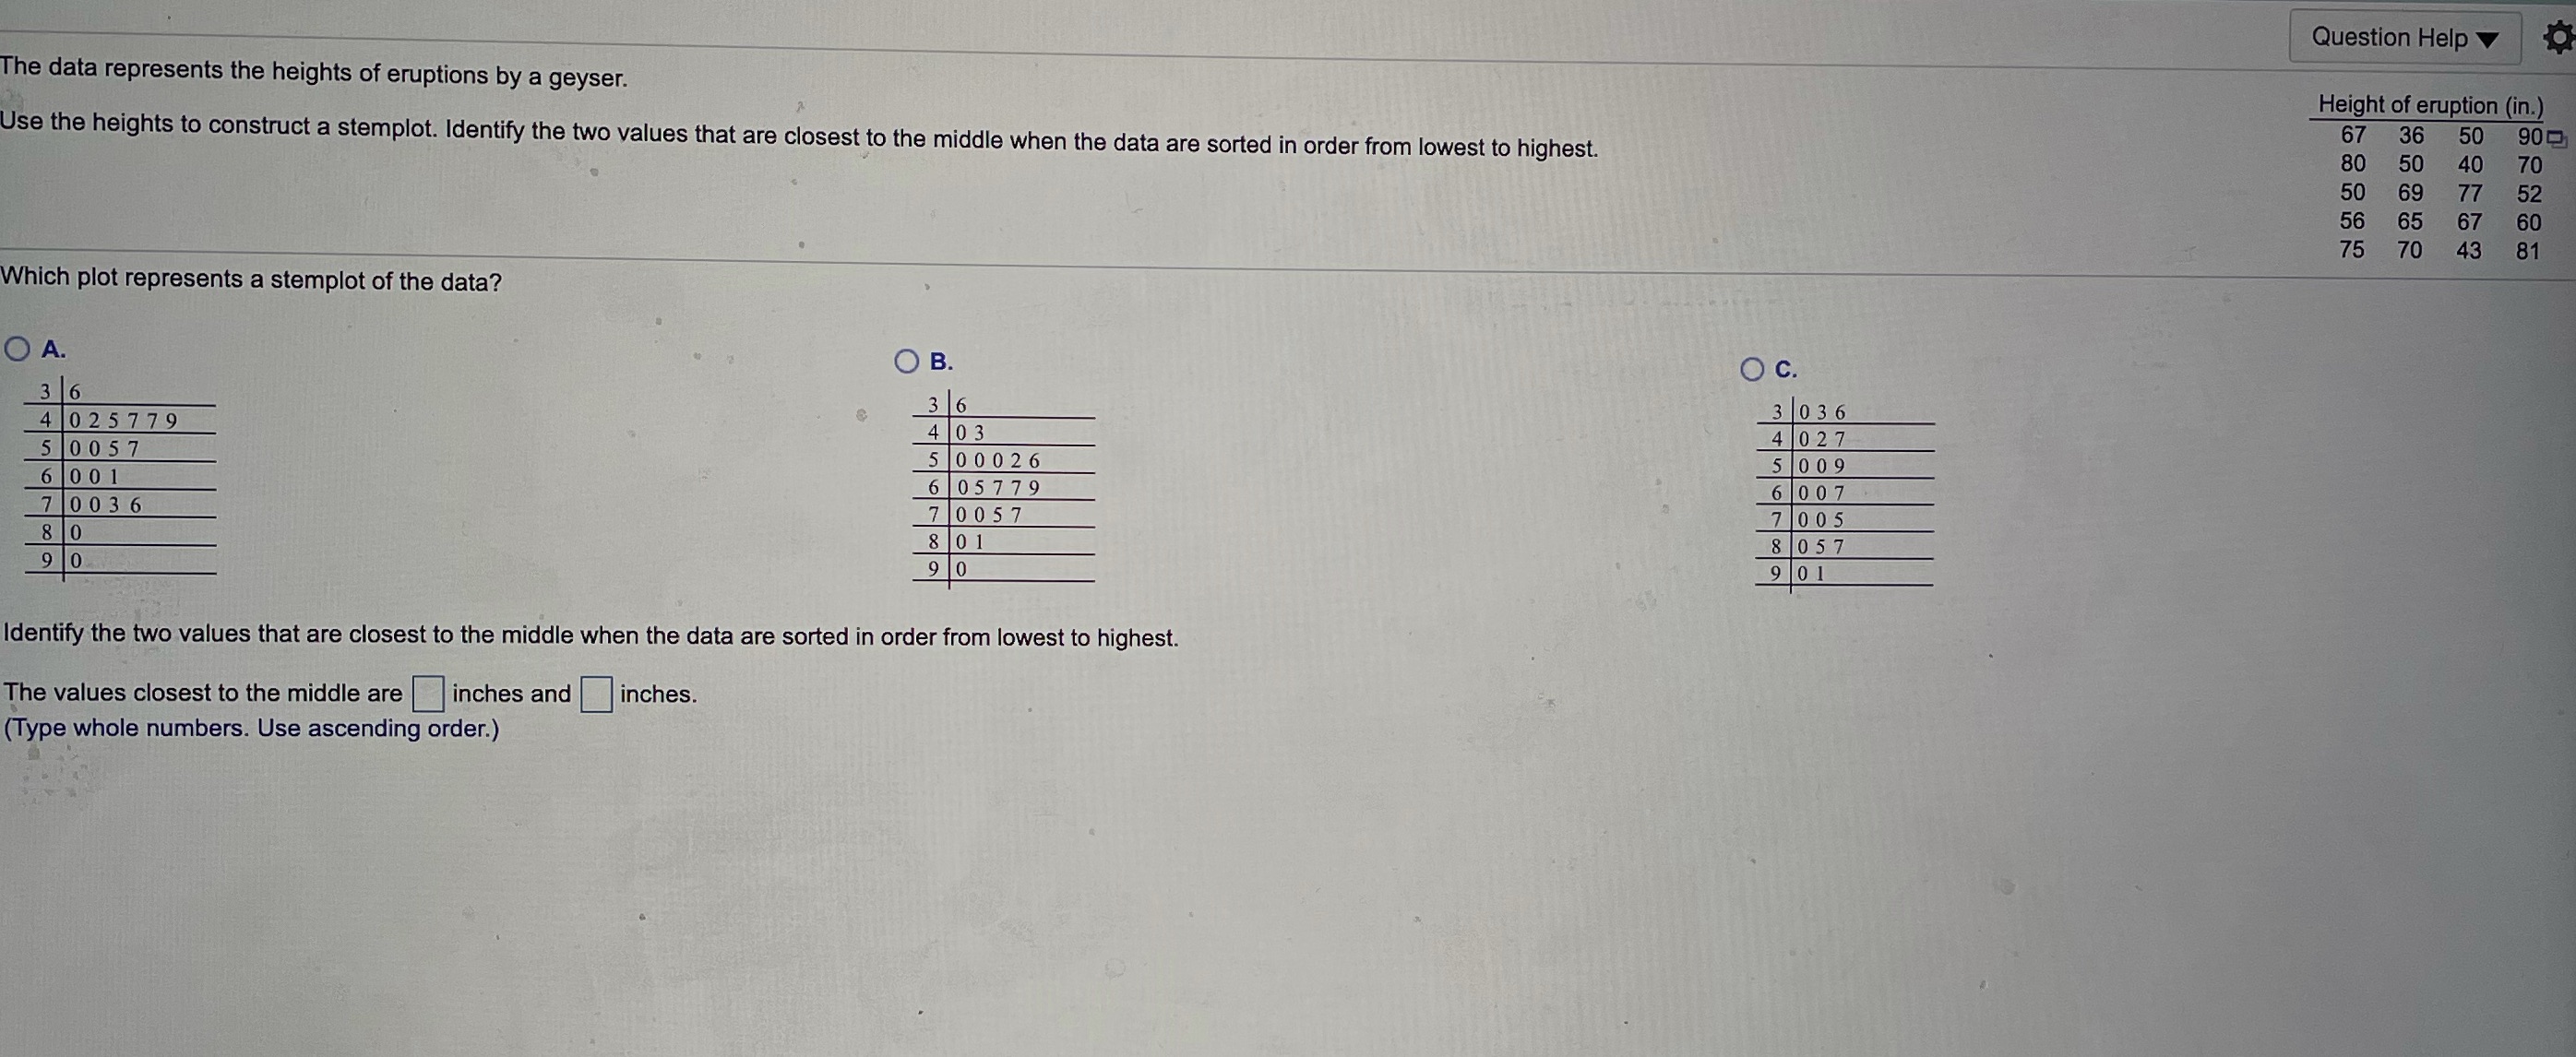
Question Help The data represents the heights of eruptions by a geyser. Height of eruption (in.) Use the heights to construct a stemplot. Identify the two values that are closest to the middle when the data are sorted in order from lowest to highest. 57 36 50 90 80 50 40 70 50 69 77 52 56 65 67 60 75 70 43 81 Which plot represents a stemplot of the data? O A. O B O c. 3 6 3 6 4 0 257 79 3 036 4 03 5 0057 4 027 5 0 0026 6 001 5 0 09 6 05779 7 0 036 6 0 07 7 0 057 8 0 7 0 05 8 01 8 057 9 0 9 0 9 01 Identify the two values that are closest to the middle when the data are sorted in order from lowest to highest. The values closest to the middle are inches and inches. (Type whole numbers. Use ascending order.)
Step by Step Solution
There are 3 Steps involved in it

Get step-by-step solutions from verified subject matter experts