

Question: Please answer. Refer the following table. Airspace Technologies Inc. Comparative Balance Sheet Information November 30 (millions of S) 2017 2016 2015 Cash $ 73$ 245
Please answer.
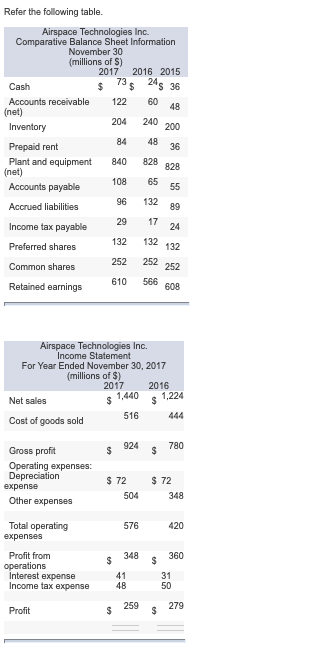
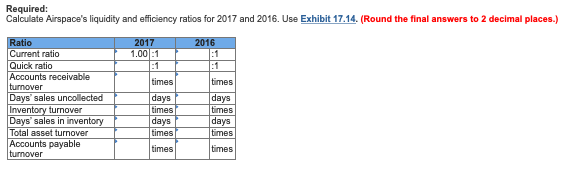
Refer the following table. Airspace Technologies Inc. Comparative Balance Sheet Information November 30 (millions of S) 2017 2016 2015 Cash $ 73$ 245 36 Accounts receivable 122 6020 (net) Inventory Prepaid rent Plant and equipment (net) Accounts payable Accrued liabilities Income tax payable Preferred shares Common shares Retained earnings Airspace Technologies Inc. Income Statement For Year Ended November 30, 2017 (millions of $) 2017 2016 Net sales $ 1,440 $1,224 Cost of goods sold 516 444 $ 924 780 Gross profit Operating expenses: Depreciation expense Other expenses $ 72 504 $ 72 348 Total operating expenses 576 420 Profit from operations Interest expense Income tax expense $ 348 41 48 $ 259 360 31 50 279 Profit Required: Calculate Airspace's liquidity and efficiency ratios for 2017 and 2016. Use Exhibit 17.14. (Round the final answers to 2 decimal places.) 2016 2017 1.000:1 times times Ratio Current ratio Quick ratio Accounts receivable Iturnover Days sales uncollected Inventory turnover Days' sales in inventory Total asset turnover Accounts payable turnover days days days I times days Iti mes times times
Step by Step Solution
There are 3 Steps involved in it

Get step-by-step solutions from verified subject matter experts