

Question: please answer, thank you! b) Using Exhibit 1, draw the YTM curve for bond A, B, and C in one graph for both at the
please answer, thank you! 
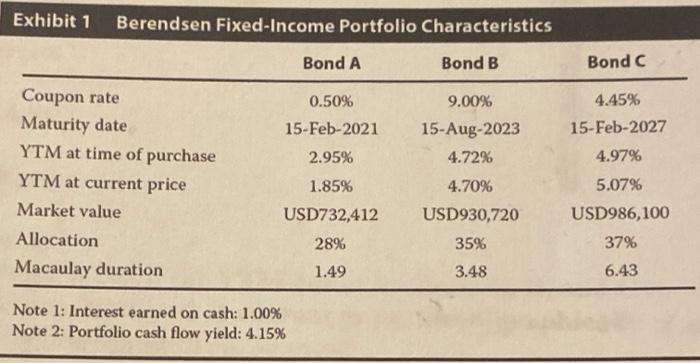
b) Using Exhibit 1, draw the YTM curve for bond A, B, and C in one graph for both at the time of purchase and at current price. Show graphically that the yield curve has steepened (either hand draw or excel). hale in the last Exhibit 1 Berendsen Fixed Income Portfolio Characteristics Bond A Bond B Bond C 0.50% 15-Feb-2021 2.95% 9.00% 15-Aug-2023 4.72% 4.45% 15-Feb-2027 4.97% Coupon rate Maturity date YTM at time of purchase YTM at current price Market value Allocation Macaulay duration 1.85% USD732,412 4.70% USD930,720 35% 5.07% USD986,100 37% 6.43 28% 1.49 3.48 Note 1: Interest earned on cash: 1.00% Note 2: Portfolio cash flow yield: 4.15%
Step by Step Solution
There are 3 Steps involved in it
1 Expert Approved Answer
Step: 1 Unlock

Question Has Been Solved by an Expert!
Get step-by-step solutions from verified subject matter experts
Step: 2 Unlock
Step: 3 Unlock