

Question: Using Exhibit 1, draw the YTM curve for bond A, B, and C in one graph for both at the time of purchase and at
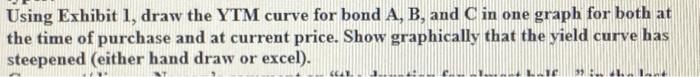
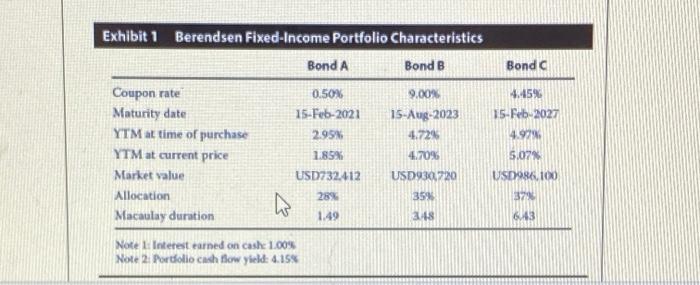
Using Exhibit 1, draw the YTM curve for bond A, B, and C in one graph for both at the time of purchase and at current price. Show graphically that the yield curve has steepened (either hand draw or excel). Bonda 4.45% 15-Feb-2027 Exhibit 1 Berendsen Fixed Income Portfolio Characteristics Bond A Bond B Coupon rate 0.50% 9.00% Maturity date 15-Feb-2021 15-Aug-2023 YTM at time of purchase 2.95 4.22 YTM at current price 1.85% 4.70% Market value USD732412 USD930,720 Allocation 28% 359 Macaulay duration 1.49 3148 4.920 5.07% USD986.100 37 643 Note Interest earned on cash 1.00% Note 2 Portfolio cash flow yield: 4.15%
Step by Step Solution
There are 3 Steps involved in it
1 Expert Approved Answer
Step: 1 Unlock

Question Has Been Solved by an Expert!
Get step-by-step solutions from verified subject matter experts
Step: 2 Unlock
Step: 3 Unlock