

Question: Please answer the 3 questions listed. Full info provided. Lee Enterprise Company and Valuation Ratios in the Publication Industry The publication industry has always represented
Please answer the 3 questions listed. Full info provided.
Lee Enterprise Company and Valuation Ratios in the Publication Industry
The publication industry has always represented a prime example of a competitive industry. New innovations are easily observed and imitated, start-up costs are generally quite high and the entry and exit of new players is frequent. 2020 represented a particularly turbulent year for the industry.
The Newspaper Publishing industry, historically the primary vehicle for American journalism, has struggled in recent years to adapt its print-focused operations to a changing media landscape. The industry, which excludes online-only publications, remains reliant on its print products for revenue and has declined rapidly as advertisers have shifted their budgets to digital platforms. In a relatively short period, external competition has risen exponentially. As smartphone adoption has surged over the past five years, digital content producers have siphoned readers and advertising revenue from industry publications. Although readership has grown through online editions, it has not been enough to offset the loss of more-valuable print subscribers. Recent market data analyses show that newspaper publishing revenue in the United States reached approximately 26.5 billion U.S. dollars in 2019. Some 15 billion dollars out of that amount was generated by advertising. All in all, newspaper revenue in the country is forecast to decrease to roughly 21 billion U.S. dollars by the end of 2024. www.statista.com
Lee Enterprises, Incorporated (NYSE: LEE), a leading provider of high quality, trusted, local news and information, and a major platform for advertising in 77 markets, has scheduled an audio webcast and conference call for Thursday, December 10, 2020, at 9 a.m. Central Time. Lee plans to issue a news release before market open that day with preliminary results for its fourth fiscal quarter ended September 27, 2020. (GLOBE NEWSWIRE)
At the time of the news release, Lee stock was trading at $1.04 which resulted in valuation multiples that were the lowest among its peer group.
The stock is likely performing poorly today as LEE management failed to provide any 1st quarter guidance even though they know the results for the first two months. My guess is the beginning of FY21 is off to a poor start.
As the decision hinged on the value of the Lee Enterprise, Alden Capital made an offer to buy out Tribune Publishing at $14.25/share for $624M. They value this company at an EV/EBITDA of 7.8x based on $80M of trailing EBITDA.
- The shares of Lee Company are currently trading at an EBITDA multiple that is at the bottom of its peer group. Is EBITDA multiple appropriate for Lee? If not, what multiple do you think is justified? What is the implied share price that corresponds to that multiple?
- The table below shows the multiples for several firms in the newspaper publishing industry. What is an appropriate multiple to estimate price per share?
- Given Table-1 that shows multiples for several firms in the newspaper publishing industry and your answer in question 2, which of the multiples would most likely be the most reliable in determining the stock price of a firm? Explain in detail.
a. P/E
b. Price/Book
c. Price/Sales
d. Enterprise Value/Revenue
e. Enterprise Value/EBITDA
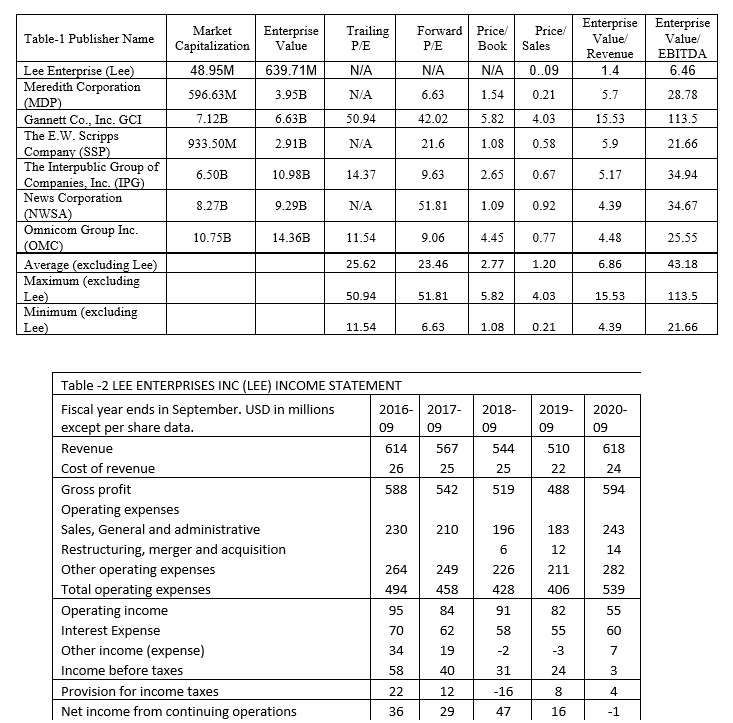
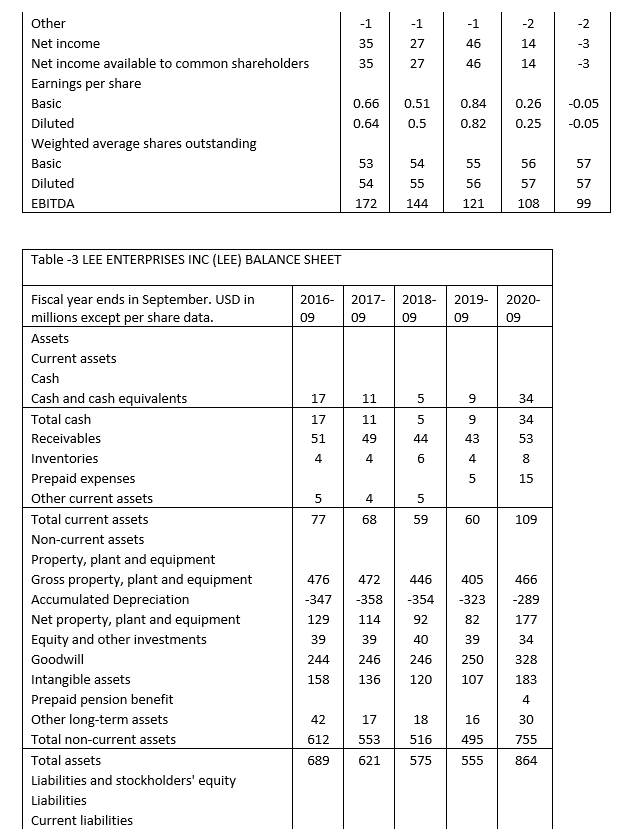
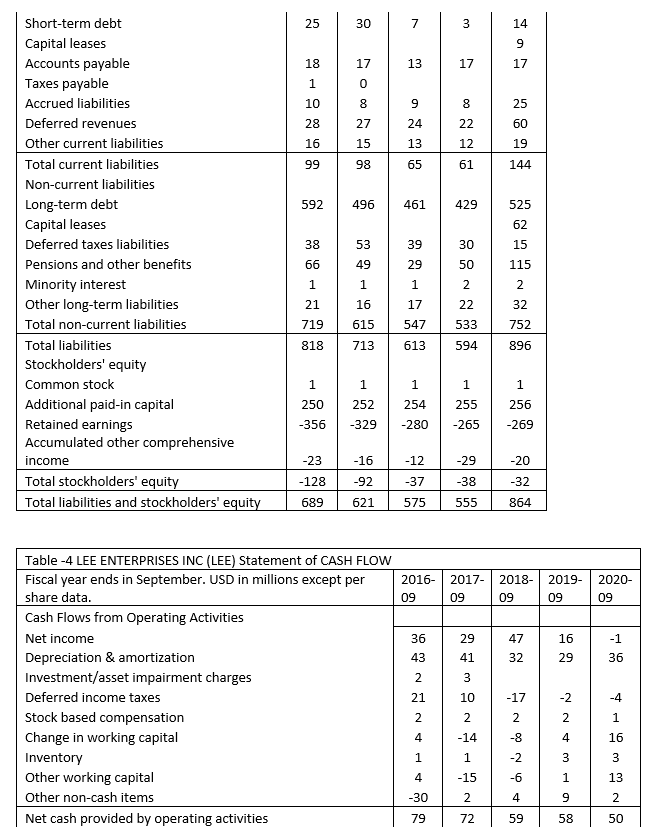
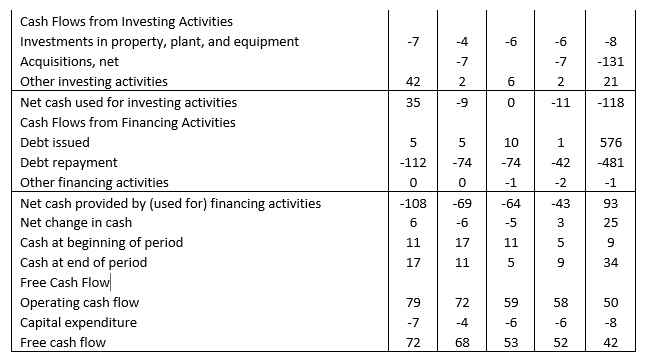
Table-1 Publisher Name Enterprise Value Trailing P/E Forward P/E Price Book Price/ Sales Market Capitalization 48.95M 596.63M Enterprise Enterprise Value Value Revenue EBITDA 1.4 6.46 639.71M N/A N/A 0..09 3.95B N/A 6.63 1.54 0.21 5.7 28.78 7.12B 6.63B 50.94 42.02 5.82 4.03 15.53 113.5 933.50M 2.91B N/A 21.6 1.08 0.58 5.9 21.66 6.50B 10.98B 14.37 9.63 2.65 0.67 5.17 34.94 Lee Enterprise (Lee) Meredith Corporation (MDP) Gannett Co., Inc. GCI The E.W. Scripps Company (SSP) The Interpublic Group of Companies, Inc. (IPG) News Corporation (NWSA) Omnicom Group Inc. (OMC) Average (excluding Lee) Maximum (excluding Lee) Minimum (excluding Lee) 8.27B 9.29B N/A 51.81 1.09 0.92 4.39 34.67 10.75B 14.36B 11.54 9.06 4.45 0.77 4.48 25.55 25.62 23.46 2.77 1.20 6.86 43.18 50.94 51.81 5.82 4.03 15.53 113.5 11.54 6.63 1.08 0.21 4.39 21.66 2018- 09 2019- 09 2020- 09 544 510 618 519 488 594 196 183 243 Table -2 LEE ENTERPRISES INC (LEE) INCOME STATEMENT Fiscal year ends in September. USD in millions 2016-2017- except per share data. 09 09 Revenue 614 567 Cost of revenue 26 25 Gross profit 588 542 Operating expenses Sales, General and administrative 230 210 Restructuring, merger and acquisition Other operating expenses 264 249 Total operating expenses 494 458 Operating income 95 84 Interest Expense Other income (expense) 19 Income before taxes 58 Provision for income taxes 22 12 Net income from continuing operations 36 29 6 12 14 226 211 282 428 406 539 91 82 55 70 62 60 -2 31 -3 24 7 3 40 -16 8 4 47 16 -1 -1 -1 -1 -2 35 46 27 27 14 14 35 46 0.84 0.26 -0.05 Other Net income Net income available to common shareholders Earnings per share Basic Diluted Weighted average shares outstanding Basic Diluted EBITDA 0.66 0.64 0.51 0.5 0.82 0.25 -0.05 54 55 56 57 53 54 55 56 57 99 172 144 121 108 Table -3 LEE ENTERPRISES INC (LEE) BALANCE SHEET 2016- 09 2017- 09 2018- 09 2019- 09 2020- 09 17 11 5 9 34 17 11 5 9 34 51 49 44 43 53 4 4 6 8 5 15 5 4 5 77 68 59 60 109 Fiscal year ends in September. USD in millions except per share data. Assets Current assets Cash Cash and cash equivalents Total cash Receivables Inventories Prepaid expenses Other current assets Total current assets Non-current assets Property, plant and equipment Gross property, plant and equipment Accumulated Depreciation Net property, plant and equipment Equity and other investments Goodwill Intangible assets Prepaid pension benefit Other long-term assets Total non-current assets Total assets Liabilities and stockholders' equity Liabilities Current liabilities 476 446 405 466 472 -358 -347 -323 -289 129 114 -354 92 40 177 39 246 250 328 244 158 246 136 120 107 183 4 17 18 42 612 553 516 495 755 689 621 575 555 864 -7 -4 -6 -6 -8 -7 -7 -131 2 6 2 21 42 35 -9 0 -11 -118 5 5 10 1 576 -112 -74 -74 -42 -481 Cash Flows from Investing Activities Investments in property, plant, and equipment Acquisitions, net Other investing activities Net cash used for investing activities Cash Flows from Financing Activities Debt issued Debt repayment Other financing activities Net cash provided by (used for) financing activities Net change in cash Cash at beginning of period Cash at end of period Free Cash Flow Operating cash flow Capital expenditure Free cash flow 0 0 -1 -2 -1 -108 -69 -64 -43 93 6 -5 3 25 11 17 11 mino 9 17 11 5 9 34 72 59 58 50 79 -7 72 -8 -4 68 53 52 42 Table-1 Publisher Name Enterprise Value Trailing P/E Forward P/E Price Book Price/ Sales Market Capitalization 48.95M 596.63M Enterprise Enterprise Value Value Revenue EBITDA 1.4 6.46 639.71M N/A N/A 0..09 3.95B N/A 6.63 1.54 0.21 5.7 28.78 7.12B 6.63B 50.94 42.02 5.82 4.03 15.53 113.5 933.50M 2.91B N/A 21.6 1.08 0.58 5.9 21.66 6.50B 10.98B 14.37 9.63 2.65 0.67 5.17 34.94 Lee Enterprise (Lee) Meredith Corporation (MDP) Gannett Co., Inc. GCI The E.W. Scripps Company (SSP) The Interpublic Group of Companies, Inc. (IPG) News Corporation (NWSA) Omnicom Group Inc. (OMC) Average (excluding Lee) Maximum (excluding Lee) Minimum (excluding Lee) 8.27B 9.29B N/A 51.81 1.09 0.92 4.39 34.67 10.75B 14.36B 11.54 9.06 4.45 0.77 4.48 25.55 25.62 23.46 2.77 1.20 6.86 43.18 50.94 51.81 5.82 4.03 15.53 113.5 11.54 6.63 1.08 0.21 4.39 21.66 2018- 09 2019- 09 2020- 09 544 510 618 519 488 594 196 183 243 Table -2 LEE ENTERPRISES INC (LEE) INCOME STATEMENT Fiscal year ends in September. USD in millions 2016-2017- except per share data. 09 09 Revenue 614 567 Cost of revenue 26 25 Gross profit 588 542 Operating expenses Sales, General and administrative 230 210 Restructuring, merger and acquisition Other operating expenses 264 249 Total operating expenses 494 458 Operating income 95 84 Interest Expense Other income (expense) 19 Income before taxes 58 Provision for income taxes 22 12 Net income from continuing operations 36 29 6 12 14 226 211 282 428 406 539 91 82 55 70 62 60 -2 31 -3 24 7 3 40 -16 8 4 47 16 -1 -1 -1 -1 -2 35 46 27 27 14 14 35 46 0.84 0.26 -0.05 Other Net income Net income available to common shareholders Earnings per share Basic Diluted Weighted average shares outstanding Basic Diluted EBITDA 0.66 0.64 0.51 0.5 0.82 0.25 -0.05 54 55 56 57 53 54 55 56 57 99 172 144 121 108 Table -3 LEE ENTERPRISES INC (LEE) BALANCE SHEET 2016- 09 2017- 09 2018- 09 2019- 09 2020- 09 17 11 5 9 34 17 11 5 9 34 51 49 44 43 53 4 4 6 8 5 15 5 4 5 77 68 59 60 109 Fiscal year ends in September. USD in millions except per share data. Assets Current assets Cash Cash and cash equivalents Total cash Receivables Inventories Prepaid expenses Other current assets Total current assets Non-current assets Property, plant and equipment Gross property, plant and equipment Accumulated Depreciation Net property, plant and equipment Equity and other investments Goodwill Intangible assets Prepaid pension benefit Other long-term assets Total non-current assets Total assets Liabilities and stockholders' equity Liabilities Current liabilities 476 446 405 466 472 -358 -347 -323 -289 129 114 -354 92 40 177 39 246 250 328 244 158 246 136 120 107 183 4 17 18 42 612 553 516 495 755 689 621 575 555 864 -7 -4 -6 -6 -8 -7 -7 -131 2 6 2 21 42 35 -9 0 -11 -118 5 5 10 1 576 -112 -74 -74 -42 -481 Cash Flows from Investing Activities Investments in property, plant, and equipment Acquisitions, net Other investing activities Net cash used for investing activities Cash Flows from Financing Activities Debt issued Debt repayment Other financing activities Net cash provided by (used for) financing activities Net change in cash Cash at beginning of period Cash at end of period Free Cash Flow Operating cash flow Capital expenditure Free cash flow 0 0 -1 -2 -1 -108 -69 -64 -43 93 6 -5 3 25 11 17 11 mino 9 17 11 5 9 34 72 59 58 50 79 -7 72 -8 -4 68 53 52 42
Step by Step Solution
There are 3 Steps involved in it

Get step-by-step solutions from verified subject matter experts