

Question: Please answer the 4 case questions in detail for Case Study 7.1: Forecasting at Snake River Industrial No copied answer, please!!! I will give you
Please answer the 4 case questions in detail for Case Study 7.1: Forecasting at Snake River Industrial
No copied answer, please!!!
I will give you a thumbs up!!!!
This is all the information about the case! Thanks!
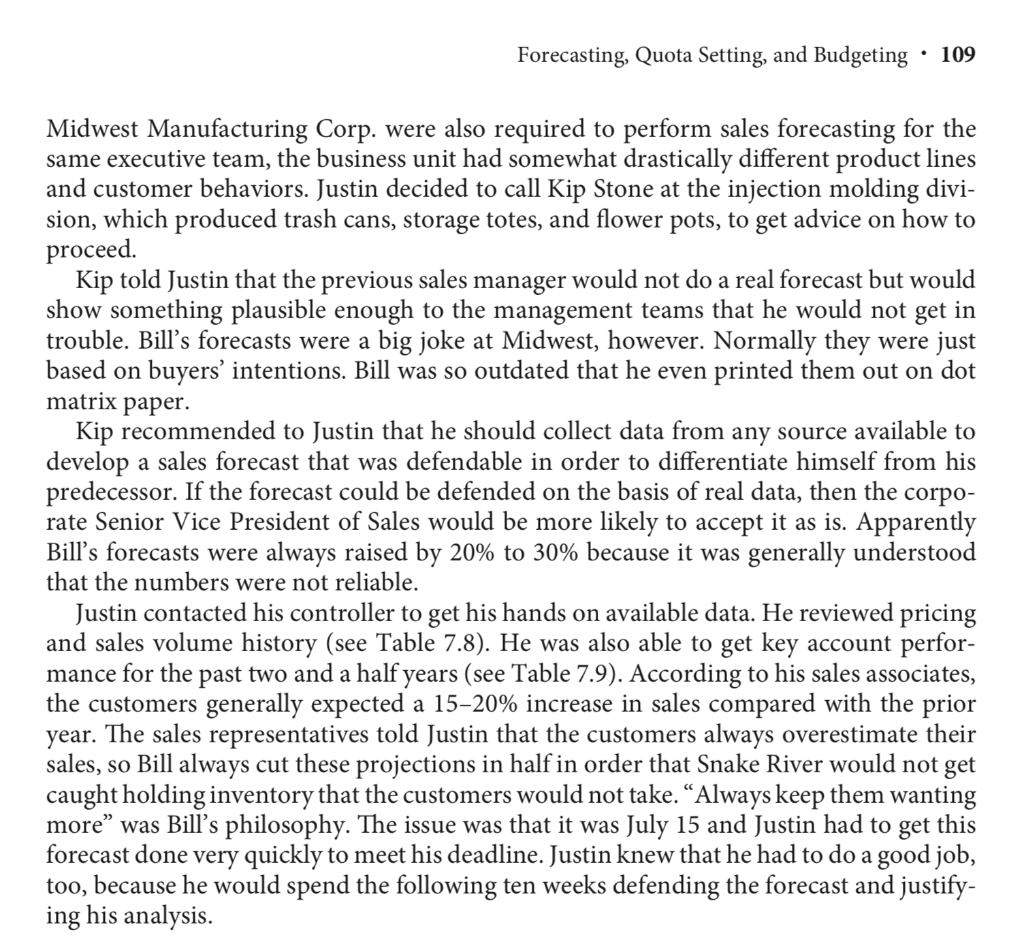
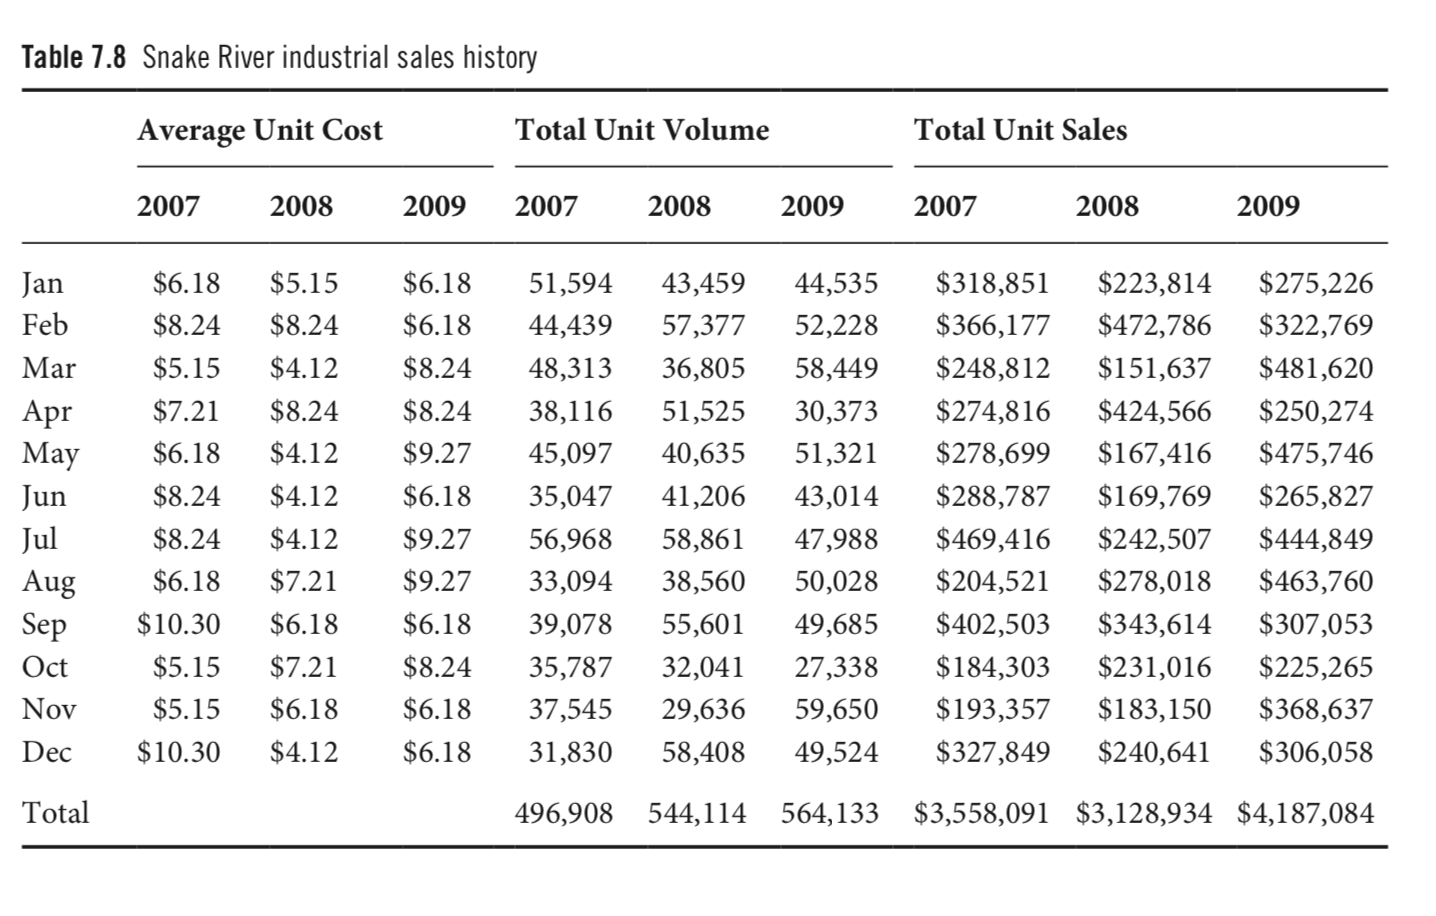
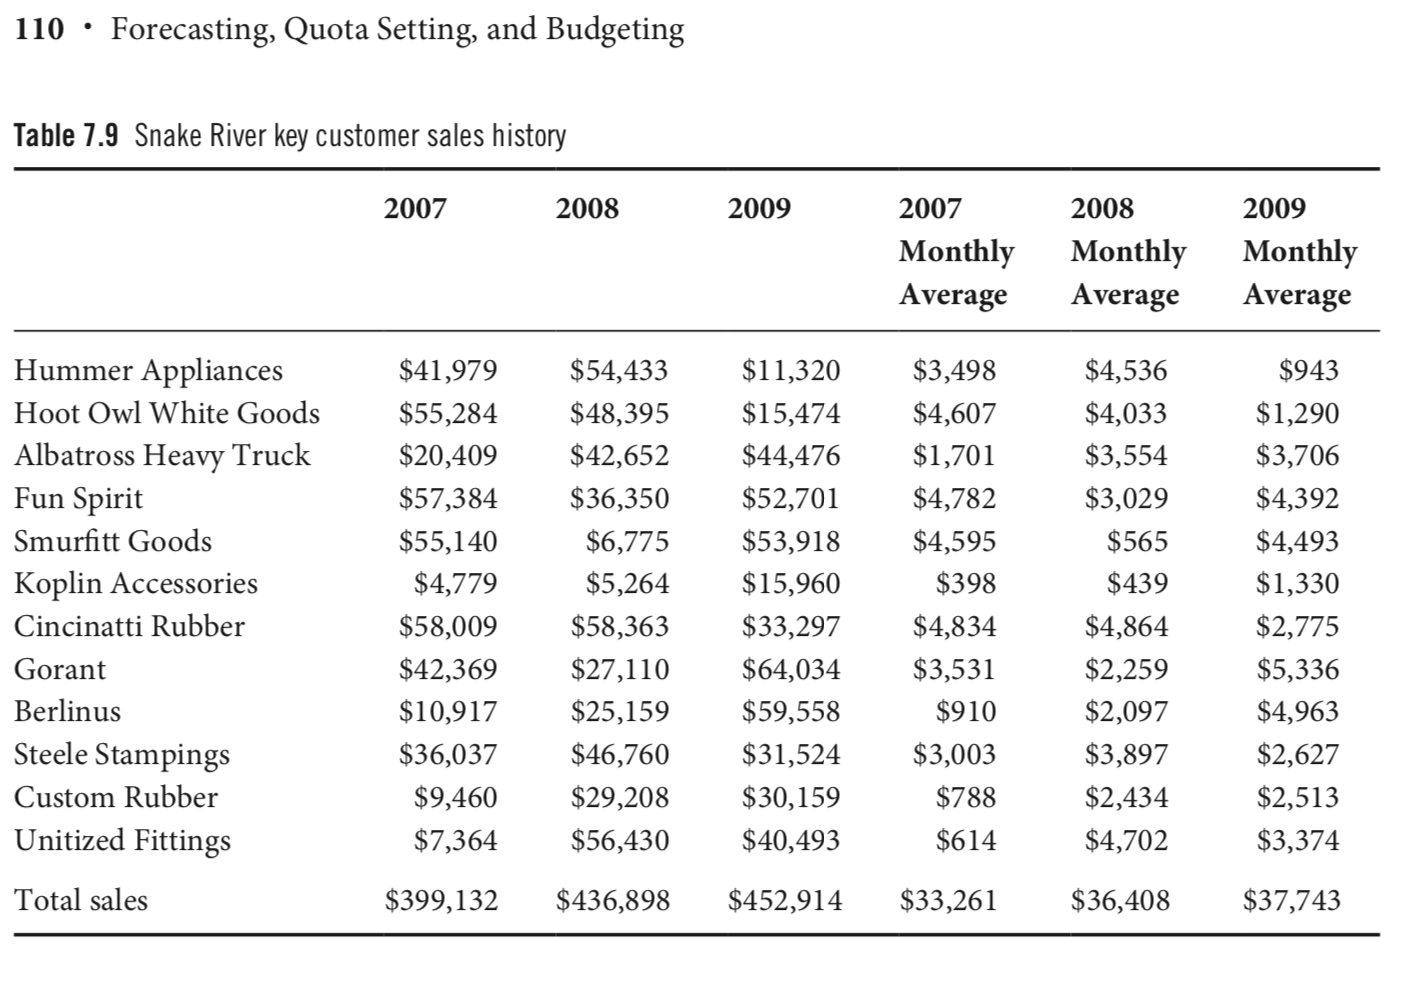
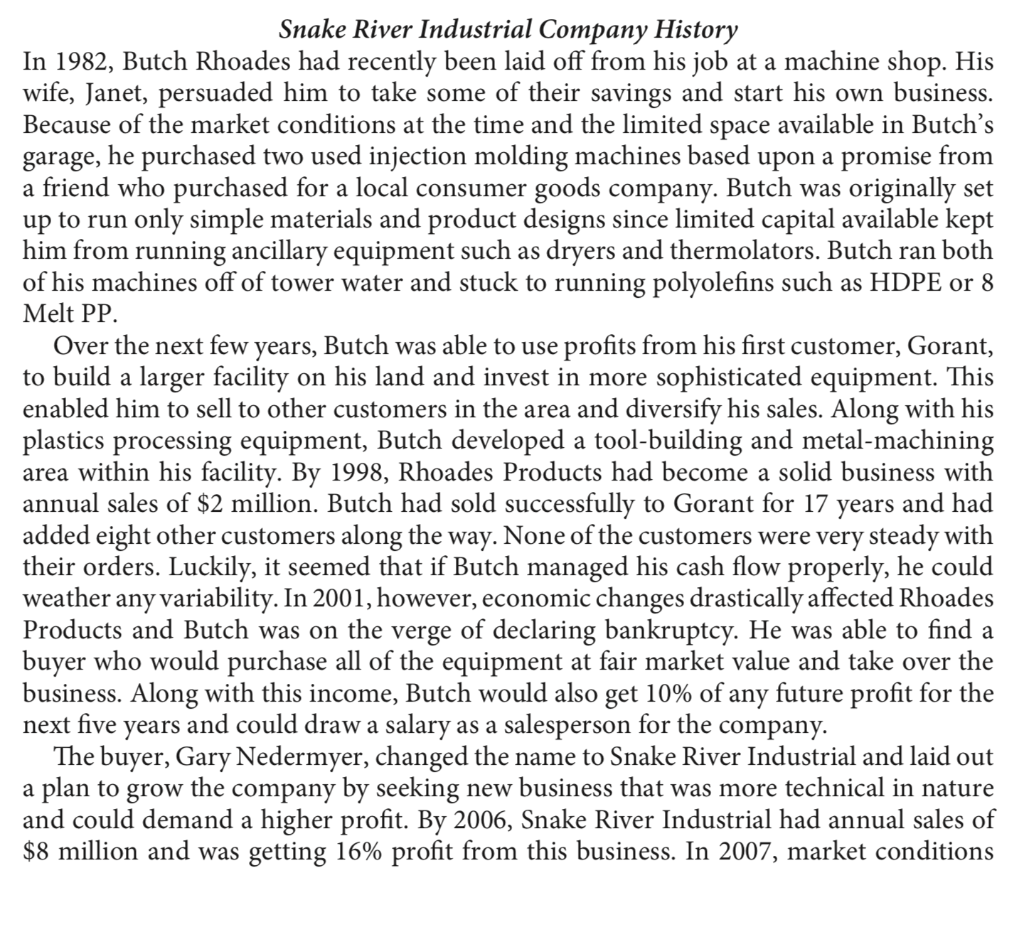
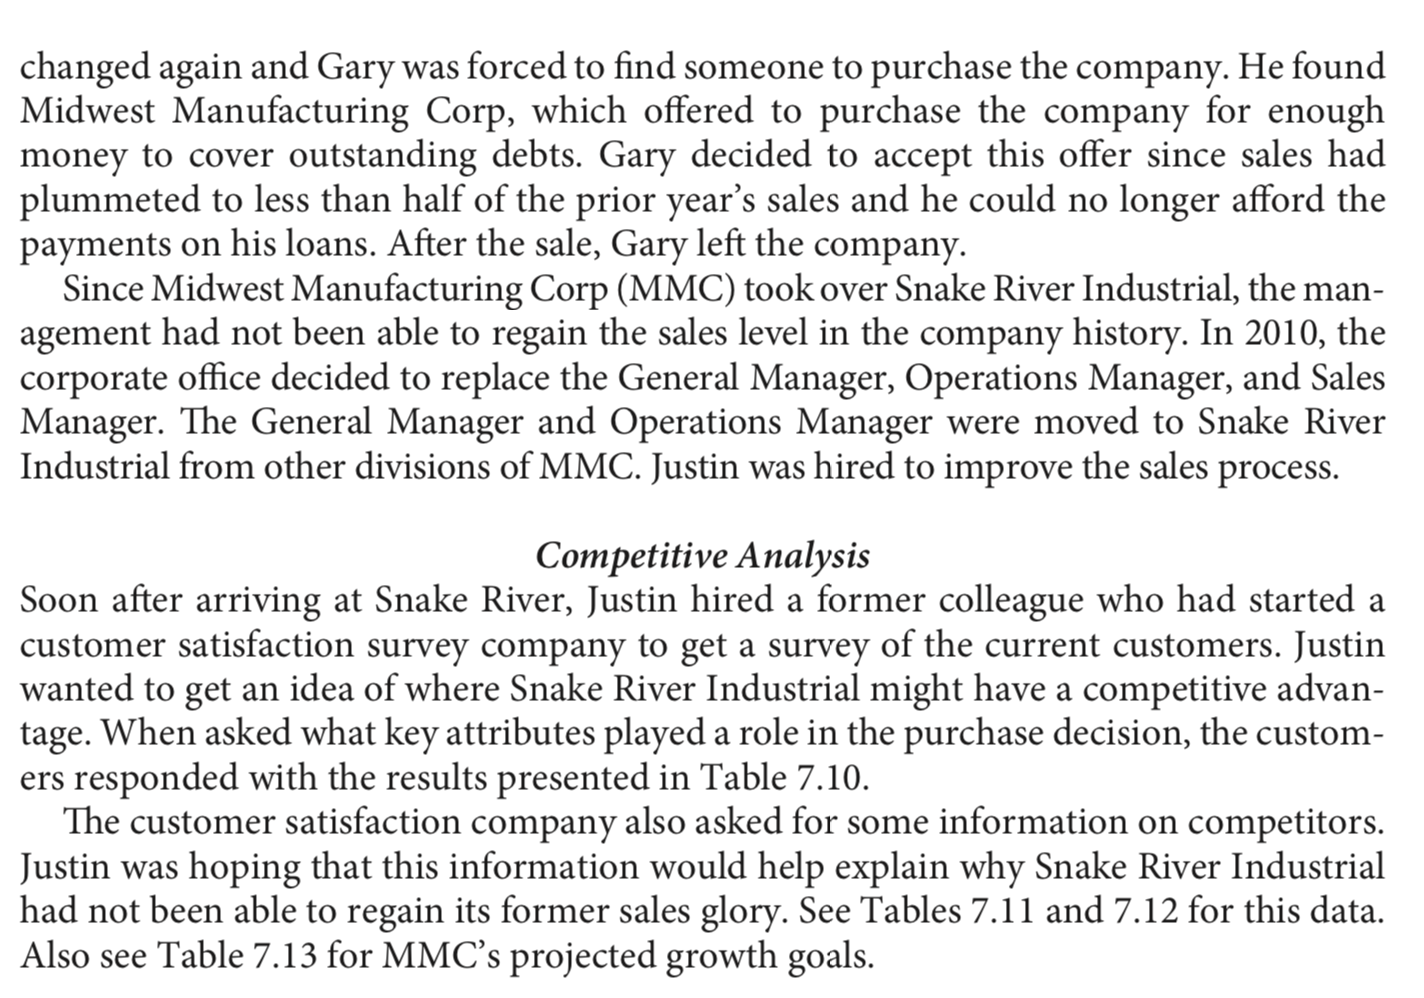
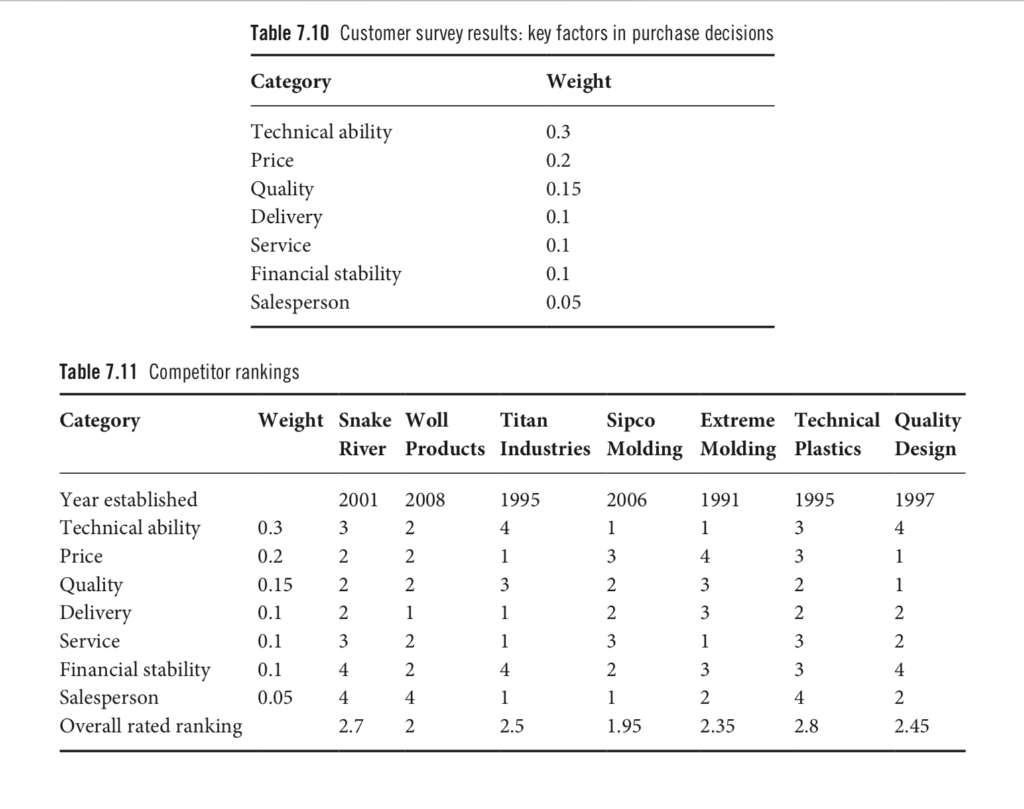
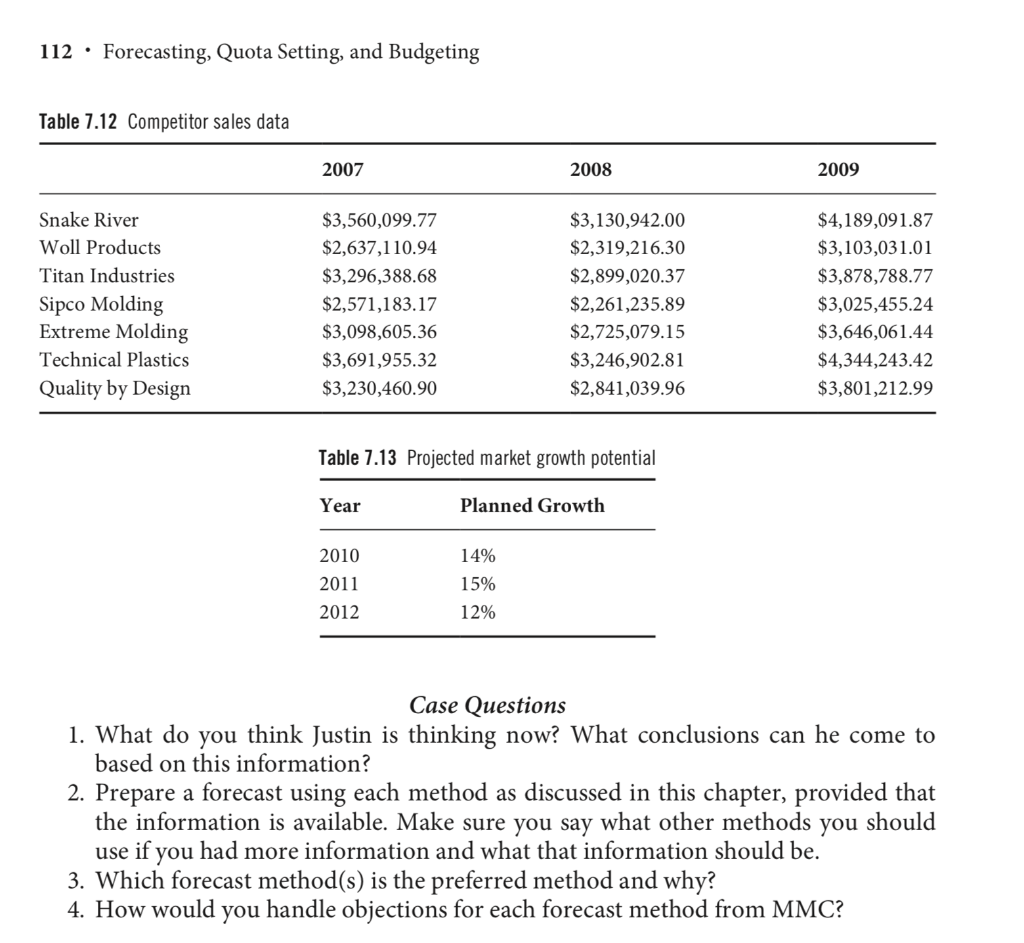
CASE 7.1: FORECASTING AT SNAKE RIVER INDUSTRIAL Justin Bobler recently accepted the position of sales manager at Snake River Industrial. He has been at Snake River for about three weeks and was just getting used to the role when the regional sales director notified him that he had to get a 2010 sales fore- cast in place by August 1 to present to him. Although Justin knew that in order to be a successful sales manager he would have to understand the available data and use it to make decisions and direct his field sales agents and commission-only sales representa- tives, he was still in the process of understanding the product line and meeting key customers. Since the previous sales manager was let go for unethical business practices, Justin did not have the benefit of advice on the forecasting process. Although other divisions of Forecasting, Quota Setting, and Budgeting 109 Midwest Manufacturing Corp. were also required to perform sales forecasting for the same executive team, the business unit had somewhat drastically different product lines and customer behaviors. Justin decided to call Kip Stone at the injection molding divi- sion, which produced trash cans, storage totes, and flower pots, to get advice on how to proceed. Kip told Justin that the previous sales manager would not do a real forecast but would show something plausible enough to the management teams that he would not get in trouble. Bill's forecasts were a big joke at Midwest, however. Normally they were just based on buyers intentions. Bill was so outdated that he even printed them out on dot matrix paper. Kip recommended to Justin that he should collect data from any source available to develop a sales forecast that was defendable in order to differentiate himself from his predecessor. If the forecast could be defended on the basis of real data, then the corpo- rate Senior Vice President of Sales would be more likely to accept it as is. Apparently Bill's forecasts were always raised by 20% to 30% because it was generally understood that the numbers were not reliable. Justin contacted his controller to get his hands on available data. He reviewed pricing and sales volume history (see Table 7.8). He was also able to get key account perfor- mance for the past two and a half years (see Table 7.9). According to his sales associates, the customers generally expected a 15-20% increase in sales compared with the prior year. The sales representatives told Justin that the customers always overestimate their sales, so Bill always cut these projections in half in order that Snake River would not get caught holding inventory that the customers would not take. Always keep them wanting more was Bill's philosophy. The issue was that it was July 15 and Justin had to get this ecast done very quickly to meet his deadline. Justin knew that he had to do a good job, too, because he would spend the following ten weeks defending the forecast and justify- ing his analysis. Table 7.8 Snake River industrial sales history Average Unit Cost Total Unit Volume Total Unit Sales 2007 2008 2009 2007 2008 2009 2007 2008 2009 Feb Mar Apr May Jun Jul Aug Sep Oct Nov Dec $6.18 $8.24 $5.15 $7.21 $6.18 $8.24 $8.24 $6.18 $10.30 $5.15 $5.15 $10.30 $5.15 $8.24 $4.12 $8.24 $4.12 $4.12 $4.12 $7.21 $6.18 $7.21 $6.18 $4.12 $6.18 $6.18 $8.24 $8.24 $9.27 $6.18 $9.27 $9.27 $6.18 $8.24 $6.18 $6.18 51,594 44,439 48,313 38,116 45,097 35,047 56,968 33,094 39,078 35,787 37,545 31,830 43,459 57,377 36,805 51,525 40,635 41,206 58,861 38,560 55,601 32,041 29,636 58,408 44,535 52,228 58,449 30,373 51,321 43,014 47,988 50,028 49,685 27,338 59,650 49,524 $318,851 $366,177 $248,812 $274,816 $278,699 $288,787 $469,416 $204,521 $402,503 $184,303 $ 193,357 $327,849 $223,814 $472,786 $151,637 $424,566 $167,416 $169,769 $242,507 $278,018 $343,614 $231,016 $183,150 $240,641 $275,226 $322,769 $481,620 $250,274 $475,746 $265,827 $444,849 $463,760 $307,053 $225,265 $368,637 $306,058 Total 496,908 544,114 564,133 $3,558,091 $3,128,934 $4,187,084 110 Forecasting, Quota Setting, and Budgeting Table 7.9 Snake River key customer sales history 2007 2008 2009 2007 Monthly Average 2008 Monthly Average 2009 Monthly Average Hummer Appliances Hoot Owl White Goods Albatross Heavy Truck Fun Spirit Smurfitt Goods Koplin Accessories Cincinatti Rubber Gorant Berlinus Steele Stampings Custom Rubber Unitized Fittings Total sales $41,979 $55,284 $20,409 $57,384 $55,140 $4,779 $58,009 $42,369 $10,917 $36,037 $9,460 $7,364 $54,433 $48,395 $42,652 $36,350 $6,775 $5,264 $58,363 $27,110 $25,159 $46,760 $29,208 $56,430 $11,320 $15,474 $44,476 $52,701 $53,918 $15,960 $33,297 $64,034 $59,558 $31,524 $30,159 $40,493 $3,498 $4,607 $1,701 $4,782 $4,595 $398 $4,834 $3,531 $910 $3,003 $788 $614 $4,536 $4,033 $3,554 $3,029 $565 $439 $4,864 $2,259 $2,097 $3,897 $2,434 $4,702 $943 $1,290 $3,706 $4,392 $4,493 $1,330 $2,775 $5,336 $4,963 $2,627 $2,513 $3,374 $399,132 $436,898 $452,914 $33,261 $36,408 $37,743 Snake River Industrial Company History In 1982, Butch Rhoades had recently been laid off from his job at a machine shop. His wife, Janet, persuaded him to take some of their savings and start his own business. Because of the market conditions at the time and the limited space available in Butchs garage, he purchased two used injection molding machines based upon a promise from a friend who purchased for a local consumer goods company. Butch was originally set up to run only simple materials and product designs since limited capital available kept him from running ancillary equipment such as dryers and thermolators. Butch ran both of his machines off of tower water and stuck to running polyolefins such as HDPE or 8 Melt PP. Over the next few years, Butch was able to use profits from his first customer, Gorant, to build a larger facility on his land and invest in more sophisticated equipment. This enabled him to sell to other customers in the area and diversify his sales. Along with his plastics processing equipment, Butch developed a tool-building and metal-machining area within his facility. By 1998, Rhoades Products had become a solid business with annual sales of $2 million. Butch had sold successfully to Gorant for 17 years and had added eight other customers along the way. None of the customers were very steady with their orders. Luckily, it seemed that if Butch managed his cash flow properly, he could weather any variability. In 2001, however, economic changes drastically affected Rhoades Products and Butch was on the verge of declaring bankruptcy. He was able to find a buyer who would purchase all of the equipment at fair market value and take over the business. Along with this income, Butch would also get 10% of any future profit for the next five years and could draw a salary as a salesperson for the company. The buyer, Gary Nedermyer, changed the name to Snake River Industrial and laid out a plan to grow the company by seeking new business that was more technical in nature and could demand a higher profit. By 2006, Snake River Industrial had annual sales of $8 million and was getting 16% profit from this business. In 2007, market conditions changed again and Gary was forced to find someone to purchase the company. He found Midwest Manufacturing Corp, which offered to purchase the company for enough money to cover outstanding debts. Gary decided to accept this offer since sales had plummeted to less than half of the prior year's sales and he could no longer afford the payments on his loans. After the sale, Gary left the company. Since Midwest Manufacturing Corp (MMC) took over Snake River Industrial, the man- agement had not been able to regain the sales level in the company history. In 2010, the corporate office decided to replace the General Manager, Operations Manager, and Sales Manager. The General Manager and Operations Manager were moved to Snake River Industrial from other divisions of MMC. Justin was hired to improve the sales process. Competitive Analysis Soon after arriving at Snake River, Justin hired a former colleague who had started a customer satisfaction survey company to get a survey of the current customers. Justin wanted to get an idea of where Snake River Industrial might have a competitive advan- tage. When asked what key attributes played a role in the purchase decision, the custom- ers responded with the results presented in Table 7.10. The customer satisfaction company also asked for some information on competitors. Justin was hoping that this information would help explain why Snake River Industrial had not been able to regain its former sales glory. See Tables 7.11 and 7.12 for this data. Also see Table 7.13 for MMC's projected growth goals. Table 7.10 Customer survey results: key factors in purchase decisions Category Weight Technical ability Price Quality Delivery Service Financial stability Salesperson 0.3 0.2 0.15 0.1 0.1 0.1 0.05 Table 7.11 Competitor rankings Category Weight Snake Woll Titan Sipco Extreme Technical Quality River Products Industries Molding Molding Plastics Design 2006 1991 1995 1997 2001 3 2 2 2 3 1995 4 1 3 2 Year established Technical ability 0.3 Price 0.2 Quality 0.15 Delivery 0.1 Service 0.1 Financial stability 0. 1 Salesperson 0.05 Overall rated ranking 2008 2 2 2 1 2 2 4 3 4 4 2.5 1.95 2.35 2.8 2.45 112 Forecasting, Quota Setting, and Budgeting Table 7.12 Competitor sales data 2007 2008 2009 Snake River Woll Products Titan Industries Sipco Molding Extreme Molding Technical Plastics Quality by Design $3,560,099.77 $2,637,110.94 $3,296,388.68 $2,571,183.17 $3,098,605.36 $3,691,955.32 $3,230,460.90 $3,130,942.00 $2,319,216.30 $2,899,020.37 $2,261,235.89 $2,725,079.15 $3,246,902.81 $2,841,039.96 $4,189,091.87 $3,103,031.01 $3,878,788.77 $3,025,455.24 $3,646,061.44 $4,344,243.42 $3,801,212.99 Table 7.13 Projected market growth potential Year Planned Growth 2010 2011 2012 14% 15% 12% Case Questions 1. What do you think Justin is thinking now? What conclusions can he come to based on this information? 2. Prepare a forecast using each method as discussed in this chapter, provided that the information is available. Make sure you say what other methods you should use if you had more information and what that information should be. 3. Which forecast method(s) is the preferred method and why? 4. How would you handle objections for each forecast method from MMC? CASE 7.1: FORECASTING AT SNAKE RIVER INDUSTRIAL Justin Bobler recently accepted the position of sales manager at Snake River Industrial. He has been at Snake River for about three weeks and was just getting used to the role when the regional sales director notified him that he had to get a 2010 sales fore- cast in place by August 1 to present to him. Although Justin knew that in order to be a successful sales manager he would have to understand the available data and use it to make decisions and direct his field sales agents and commission-only sales representa- tives, he was still in the process of understanding the product line and meeting key customers. Since the previous sales manager was let go for unethical business practices, Justin did not have the benefit of advice on the forecasting process. Although other divisions of Forecasting, Quota Setting, and Budgeting 109 Midwest Manufacturing Corp. were also required to perform sales forecasting for the same executive team, the business unit had somewhat drastically different product lines and customer behaviors. Justin decided to call Kip Stone at the injection molding divi- sion, which produced trash cans, storage totes, and flower pots, to get advice on how to proceed. Kip told Justin that the previous sales manager would not do a real forecast but would show something plausible enough to the management teams that he would not get in trouble. Bill's forecasts were a big joke at Midwest, however. Normally they were just based on buyers intentions. Bill was so outdated that he even printed them out on dot matrix paper. Kip recommended to Justin that he should collect data from any source available to develop a sales forecast that was defendable in order to differentiate himself from his predecessor. If the forecast could be defended on the basis of real data, then the corpo- rate Senior Vice President of Sales would be more likely to accept it as is. Apparently Bill's forecasts were always raised by 20% to 30% because it was generally understood that the numbers were not reliable. Justin contacted his controller to get his hands on available data. He reviewed pricing and sales volume history (see Table 7.8). He was also able to get key account perfor- mance for the past two and a half years (see Table 7.9). According to his sales associates, the customers generally expected a 15-20% increase in sales compared with the prior year. The sales representatives told Justin that the customers always overestimate their sales, so Bill always cut these projections in half in order that Snake River would not get caught holding inventory that the customers would not take. Always keep them wanting more was Bill's philosophy. The issue was that it was July 15 and Justin had to get this ecast done very quickly to meet his deadline. Justin knew that he had to do a good job, too, because he would spend the following ten weeks defending the forecast and justify- ing his analysis. Table 7.8 Snake River industrial sales history Average Unit Cost Total Unit Volume Total Unit Sales 2007 2008 2009 2007 2008 2009 2007 2008 2009 Feb Mar Apr May Jun Jul Aug Sep Oct Nov Dec $6.18 $8.24 $5.15 $7.21 $6.18 $8.24 $8.24 $6.18 $10.30 $5.15 $5.15 $10.30 $5.15 $8.24 $4.12 $8.24 $4.12 $4.12 $4.12 $7.21 $6.18 $7.21 $6.18 $4.12 $6.18 $6.18 $8.24 $8.24 $9.27 $6.18 $9.27 $9.27 $6.18 $8.24 $6.18 $6.18 51,594 44,439 48,313 38,116 45,097 35,047 56,968 33,094 39,078 35,787 37,545 31,830 43,459 57,377 36,805 51,525 40,635 41,206 58,861 38,560 55,601 32,041 29,636 58,408 44,535 52,228 58,449 30,373 51,321 43,014 47,988 50,028 49,685 27,338 59,650 49,524 $318,851 $366,177 $248,812 $274,816 $278,699 $288,787 $469,416 $204,521 $402,503 $184,303 $ 193,357 $327,849 $223,814 $472,786 $151,637 $424,566 $167,416 $169,769 $242,507 $278,018 $343,614 $231,016 $183,150 $240,641 $275,226 $322,769 $481,620 $250,274 $475,746 $265,827 $444,849 $463,760 $307,053 $225,265 $368,637 $306,058 Total 496,908 544,114 564,133 $3,558,091 $3,128,934 $4,187,084 110 Forecasting, Quota Setting, and Budgeting Table 7.9 Snake River key customer sales history 2007 2008 2009 2007 Monthly Average 2008 Monthly Average 2009 Monthly Average Hummer Appliances Hoot Owl White Goods Albatross Heavy Truck Fun Spirit Smurfitt Goods Koplin Accessories Cincinatti Rubber Gorant Berlinus Steele Stampings Custom Rubber Unitized Fittings Total sales $41,979 $55,284 $20,409 $57,384 $55,140 $4,779 $58,009 $42,369 $10,917 $36,037 $9,460 $7,364 $54,433 $48,395 $42,652 $36,350 $6,775 $5,264 $58,363 $27,110 $25,159 $46,760 $29,208 $56,430 $11,320 $15,474 $44,476 $52,701 $53,918 $15,960 $33,297 $64,034 $59,558 $31,524 $30,159 $40,493 $3,498 $4,607 $1,701 $4,782 $4,595 $398 $4,834 $3,531 $910 $3,003 $788 $614 $4,536 $4,033 $3,554 $3,029 $565 $439 $4,864 $2,259 $2,097 $3,897 $2,434 $4,702 $943 $1,290 $3,706 $4,392 $4,493 $1,330 $2,775 $5,336 $4,963 $2,627 $2,513 $3,374 $399,132 $436,898 $452,914 $33,261 $36,408 $37,743 Snake River Industrial Company History In 1982, Butch Rhoades had recently been laid off from his job at a machine shop. His wife, Janet, persuaded him to take some of their savings and start his own business. Because of the market conditions at the time and the limited space available in Butchs garage, he purchased two used injection molding machines based upon a promise from a friend who purchased for a local consumer goods company. Butch was originally set up to run only simple materials and product designs since limited capital available kept him from running ancillary equipment such as dryers and thermolators. Butch ran both of his machines off of tower water and stuck to running polyolefins such as HDPE or 8 Melt PP. Over the next few years, Butch was able to use profits from his first customer, Gorant, to build a larger facility on his land and invest in more sophisticated equipment. This enabled him to sell to other customers in the area and diversify his sales. Along with his plastics processing equipment, Butch developed a tool-building and metal-machining area within his facility. By 1998, Rhoades Products had become a solid business with annual sales of $2 million. Butch had sold successfully to Gorant for 17 years and had added eight other customers along the way. None of the customers were very steady with their orders. Luckily, it seemed that if Butch managed his cash flow properly, he could weather any variability. In 2001, however, economic changes drastically affected Rhoades Products and Butch was on the verge of declaring bankruptcy. He was able to find a buyer who would purchase all of the equipment at fair market value and take over the business. Along with this income, Butch would also get 10% of any future profit for the next five years and could draw a salary as a salesperson for the company. The buyer, Gary Nedermyer, changed the name to Snake River Industrial and laid out a plan to grow the company by seeking new business that was more technical in nature and could demand a higher profit. By 2006, Snake River Industrial had annual sales of $8 million and was getting 16% profit from this business. In 2007, market conditions changed again and Gary was forced to find someone to purchase the company. He found Midwest Manufacturing Corp, which offered to purchase the company for enough money to cover outstanding debts. Gary decided to accept this offer since sales had plummeted to less than half of the prior year's sales and he could no longer afford the payments on his loans. After the sale, Gary left the company. Since Midwest Manufacturing Corp (MMC) took over Snake River Industrial, the man- agement had not been able to regain the sales level in the company history. In 2010, the corporate office decided to replace the General Manager, Operations Manager, and Sales Manager. The General Manager and Operations Manager were moved to Snake River Industrial from other divisions of MMC. Justin was hired to improve the sales process. Competitive Analysis Soon after arriving at Snake River, Justin hired a former colleague who had started a customer satisfaction survey company to get a survey of the current customers. Justin wanted to get an idea of where Snake River Industrial might have a competitive advan- tage. When asked what key attributes played a role in the purchase decision, the custom- ers responded with the results presented in Table 7.10. The customer satisfaction company also asked for some information on competitors. Justin was hoping that this information would help explain why Snake River Industrial had not been able to regain its former sales glory. See Tables 7.11 and 7.12 for this data. Also see Table 7.13 for MMC's projected growth goals. Table 7.10 Customer survey results: key factors in purchase decisions Category Weight Technical ability Price Quality Delivery Service Financial stability Salesperson 0.3 0.2 0.15 0.1 0.1 0.1 0.05 Table 7.11 Competitor rankings Category Weight Snake Woll Titan Sipco Extreme Technical Quality River Products Industries Molding Molding Plastics Design 2006 1991 1995 1997 2001 3 2 2 2 3 1995 4 1 3 2 Year established Technical ability 0.3 Price 0.2 Quality 0.15 Delivery 0.1 Service 0.1 Financial stability 0. 1 Salesperson 0.05 Overall rated ranking 2008 2 2 2 1 2 2 4 3 4 4 2.5 1.95 2.35 2.8 2.45 112 Forecasting, Quota Setting, and Budgeting Table 7.12 Competitor sales data 2007 2008 2009 Snake River Woll Products Titan Industries Sipco Molding Extreme Molding Technical Plastics Quality by Design $3,560,099.77 $2,637,110.94 $3,296,388.68 $2,571,183.17 $3,098,605.36 $3,691,955.32 $3,230,460.90 $3,130,942.00 $2,319,216.30 $2,899,020.37 $2,261,235.89 $2,725,079.15 $3,246,902.81 $2,841,039.96 $4,189,091.87 $3,103,031.01 $3,878,788.77 $3,025,455.24 $3,646,061.44 $4,344,243.42 $3,801,212.99 Table 7.13 Projected market growth potential Year Planned Growth 2010 2011 2012 14% 15% 12% Case Questions 1. What do you think Justin is thinking now? What conclusions can he come to based on this information? 2. Prepare a forecast using each method as discussed in this chapter, provided that the information is available. Make sure you say what other methods you should use if you had more information and what that information should be. 3. Which forecast method(s) is the preferred method and why? 4. How would you handle objections for each forecast method from MMC
Step by Step Solution
There are 3 Steps involved in it
1 Expert Approved Answer
Step: 1 Unlock

Question Has Been Solved by an Expert!
Get step-by-step solutions from verified subject matter experts
Step: 2 Unlock
Step: 3 Unlock