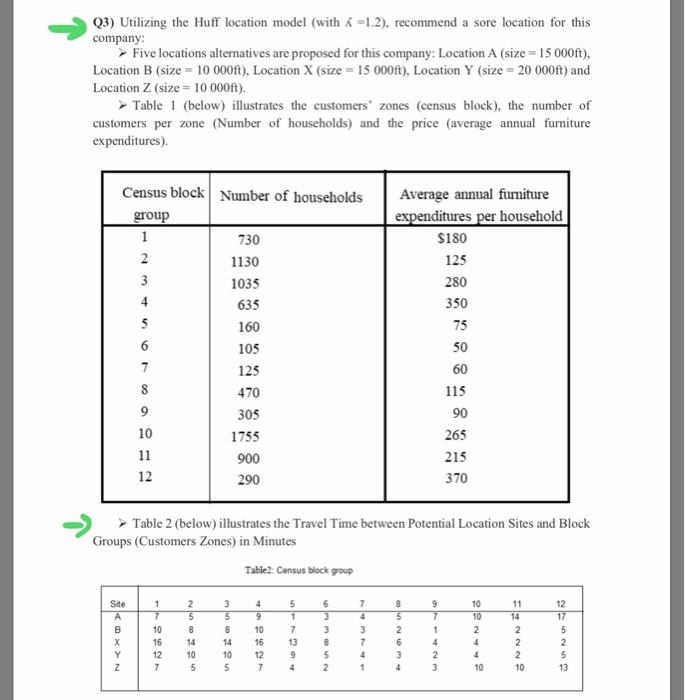
Question: please answer the below question Table 2 (below) illustrates the Travel Time between Potential Location Sites and Block Groups (Customers Zones) in Minutes Table2: Census

please answer the below question please answer the below question Table 2 (below)
please answer the below question Table 2 (below)
Table 2 (below) illustrates the Travel Time between Potential Location Sites and Block Groups (Customers Zones) in Minutes Table2: Census block group 4 9 1 7 10 16 12 2 5 8 14 10 5 3 5 8 14 10 5 5 1 7 13 9 4 11 14 2 6 3 3 8 5 2 7 4 3 7 4 10 16 12 7 8 5 2 6 3 9 7 1 4 10 10 2 4 Q3) Utilizing the Huff location model (with =1.2), recommend a sore location for this company: Five locations alternatives are proposed for this company: Location A (size=15000ft), Location B (size = 10 000ft), Location X (size = 15 000ft), Location Y (size = 20 000ft) and Location Z (size = 10 000ft). Table 1 (below) illustrates the customers' zones (census block), the number of customers per zone (Number of households) and the price (average annual furniture expenditures). Census block Number of households group 730 1130 Average annual furniture expenditures per household $180 125 1035 635 160 305 1755 900 290 215 370 Table 2 (below) illustrates the Travel Time between Potential Location Sites and Block Groups (Customers Zones) in Minutes Table2: Census block group 1 2 3 4 5 6 7 8 9 10 11 559134 1014 10 8 8 10 7 3 3 2 1 2 16 14 14 16 13 8 7 12 10 10 12 9 5 4 324 7 55 7 4 2 14 3 10

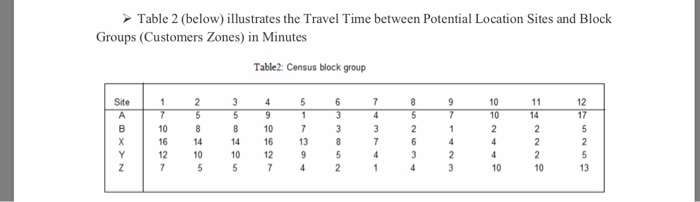
Step by Step Solution

There are 3 Steps involved in it

1 Expert Approved Answer
Step: 1 Unlock blur-text-image
Question Has Been Solved by an Expert!

Get step-by-step solutions from verified subject matter experts

Step: 2 Unlock
Step: 3 Unlock

Students Have Also Explored These Related General Management Questions!