

Question: (Please Answer) The data in the attached file is for 20 parts being produced in facility. Eleven machines are required to produce these, and the
(Please Answer)
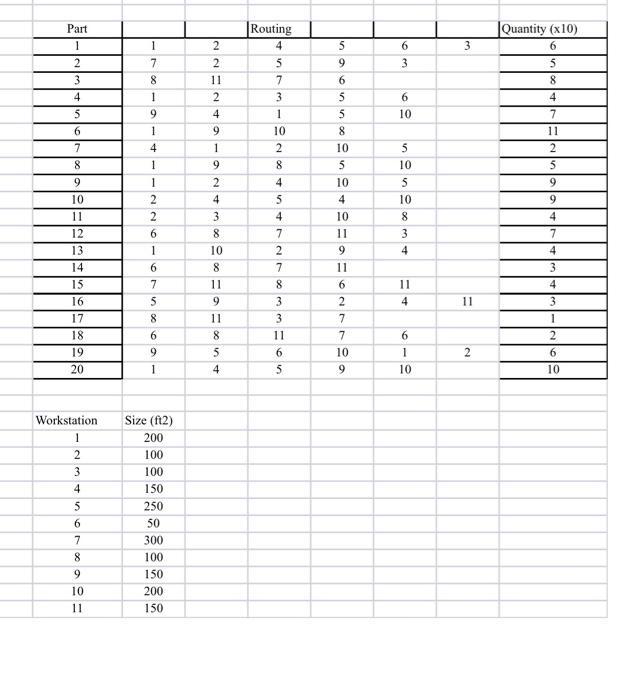
The data in the attached file is for 20 parts being produced in facility. Eleven machines are required to produce these, and the number that need to be produced each shift, on average, is given in the table. (In fact, multiple machines performing the same function are required to produce these volumes, but you can assume only one machine of each type is needed for the analysis.) The size of department required for each machine is also given. The sizes have been scaled to keep the numbers reasonable and the size of the facility, to that same scale, is a rectangle with sides 40x50. You do not need to consider aisles or any other ancillary space focus exclusively on the workstations. There are two constraints on the design. First, workstations 3 and 5 should not be near each other because of the chemicals they use. Also, workstations 1 and 5 should be near each other because they use 440V 3 current which is different from the rest of the machines. Please propose a design for this facility that maximizes adjacency. As you know, you would be asked to develop more than one in a real job but this is not your full time job so one design is enough. To get you started, this is not a product layout. With the number of workstations, initially perform an analysis to see if you can group workstations to reduce the size of the problem. Just use S-Link to reduce the required calculations. Now, its time to design the facility. If you found a smaller group or groups of workstations that naturally cluster, perform CORELAP on that group or each group. If you did not find any natural groups, perform CORELAP on all 11 workstations. When you are converting your From-To to an REL, it is best if you have no more than 25% A and no more than 25% E. Once you have the basic design from CORELAP, add workstation sizes and create a proposed layout using the ideas of SLP. Deliverables 1. Present the important steps in your design process in a PowerPoint presentation of not more than 10 slides (not including your cover slide) that would be suitable to brief you manager. This should identify the methodology, big picture what it does, and the results. The final slide should be the design. (No need to include a slide closing or questions.) 2. Provide a calculation file that succinctly shows your calculations. I suspect Excel and/or Word will be best for this. The idea is to let the reader be able to quickly follow what you did and be confident you methodology is correct.
Step by Step Solution
There are 3 Steps involved in it

Get step-by-step solutions from verified subject matter experts