

Question: Please answer the entire question before accepting this question. I really NEED help; practice for my final. Thank you. this has multiple parts to the
Please answer the entire question before accepting this question. I really NEED help; practice for my final. Thank you. this has multiple parts to the question. 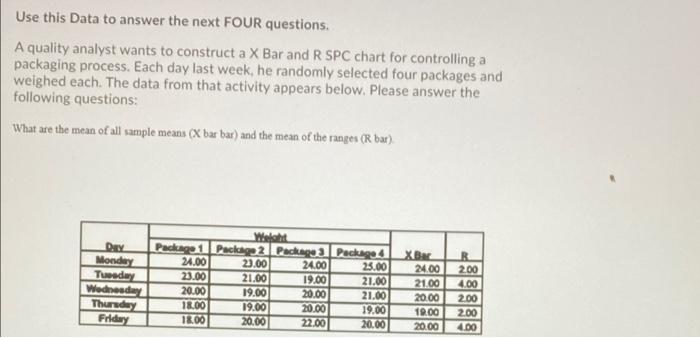
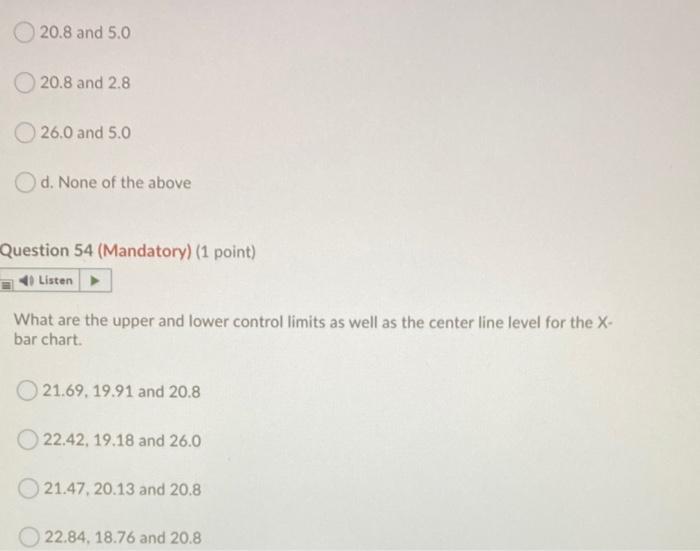
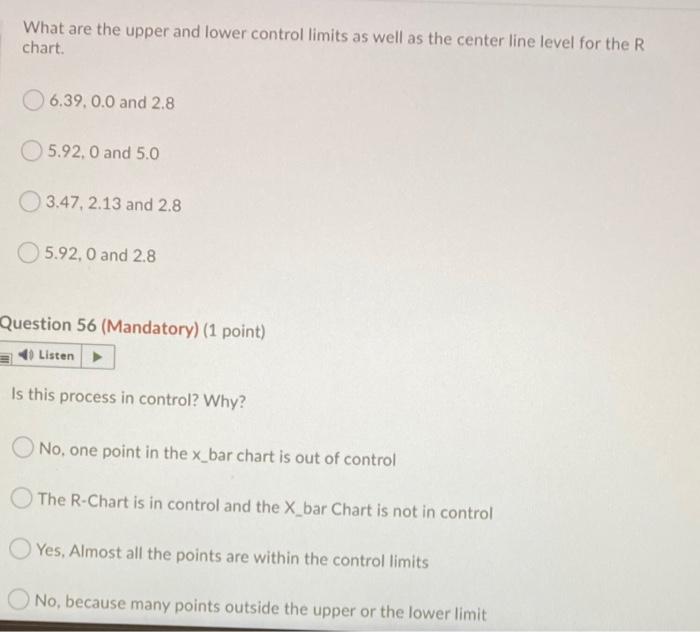
Use this Data to answer the next FOUR questions. A quality analyst wants to construct a X Bar and R SPC chart for controlling a packaging process. Each day last week, he randomly selected four packages and weighed each. The data from that activity appears below. Please answer the following questions: What are the mean of all sample means (X bar bar) and the mean of the ranges (R bar) DY Monday Today Wednesday Thursday Friday Wom Package 1 Package 2 Package Package 4 24.00 23.00 24.00 23.00 23.00 21.00 19.00 21.00 20.00 19.00 20.00 21.00 18.00 19.00 20.00 19.00 18.00 20.00 22.00 20.00 24.00 21.00 20.00 19.00 20.00 R 2.00 4.00 200 2.00 4.00 20.8 and 5.0 20.8 and 2.8 26.0 and 5.0 d. None of the above Question 54 (Mandatory) (1 point) Listen What are the upper and lower control limits as well as the center line level for the X- bar chart. 21.69, 19.91 and 20.8 22.42, 19.18 and 26.0 21.47, 20.13 and 20.8 22.84, 18.76 and 20.8 What are the upper and lower control limits as well as the center line level for the R chart. 6.39.0.0 and 2.8 5.92, 0 and 5.0 3.47, 2.13 and 2.8 5.92, 0 and 2.8 Question 56 (Mandatory) (1 point) Listen Is this process in control? Why? No, one point in the x_bar chart is out of control The R-Chart is in control and the X_bar Chart is not in control Yes, Almost all the points are within the control limits No, because many points outside the upper or the lower limit Step by Step Solution
There are 3 Steps involved in it
1 Expert Approved Answer
Step: 1 Unlock

Question Has Been Solved by an Expert!
Get step-by-step solutions from verified subject matter experts
Step: 2 Unlock
Step: 3 Unlock