

Question: Please Answer the first 3 questions, I really need help understanding or getting at least something down for those 3 questions. Please explain as thoroughly
 Please Answer the first 3 questions, I really need help understanding or getting at least something down for those 3 questions. Please explain as thoroughly as possible (I'm a slow learner). You can refer to the excel document for data as well as hopefully helping me figure out what to put in the green spaces in the excel document (mostly just need answer to those 3 questions). Thank you!
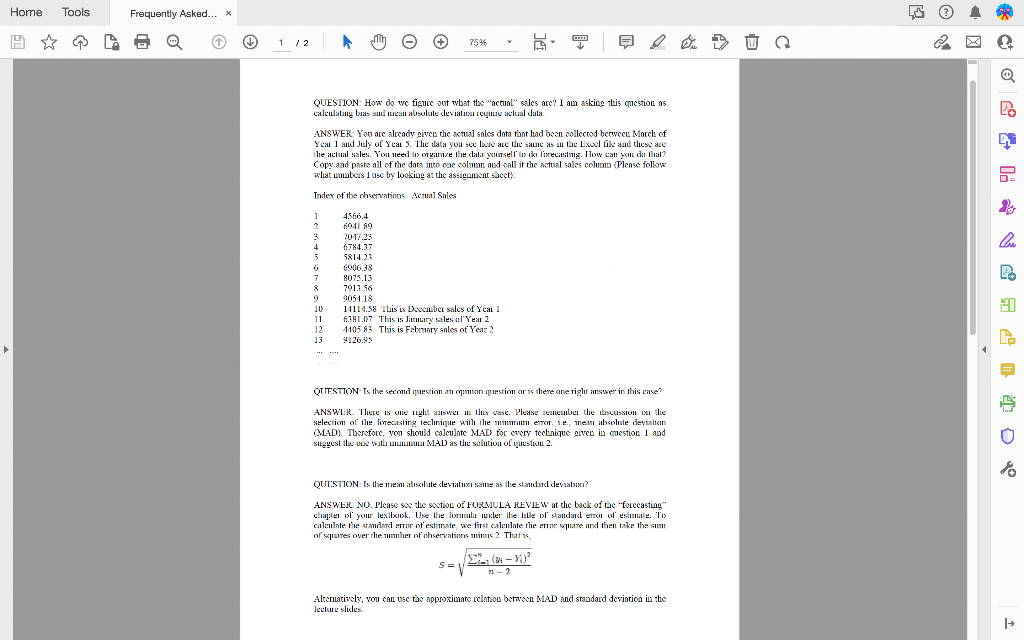
Below are some frequently asked questions about the homework that may help answer the first 3 questions I need answered
Questions I need answered specifically,
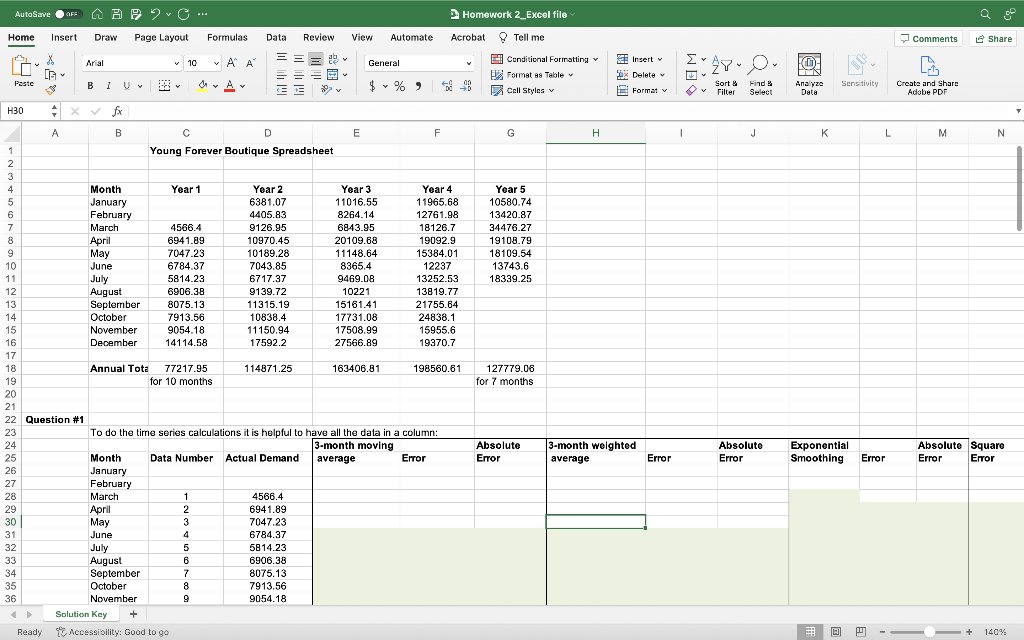
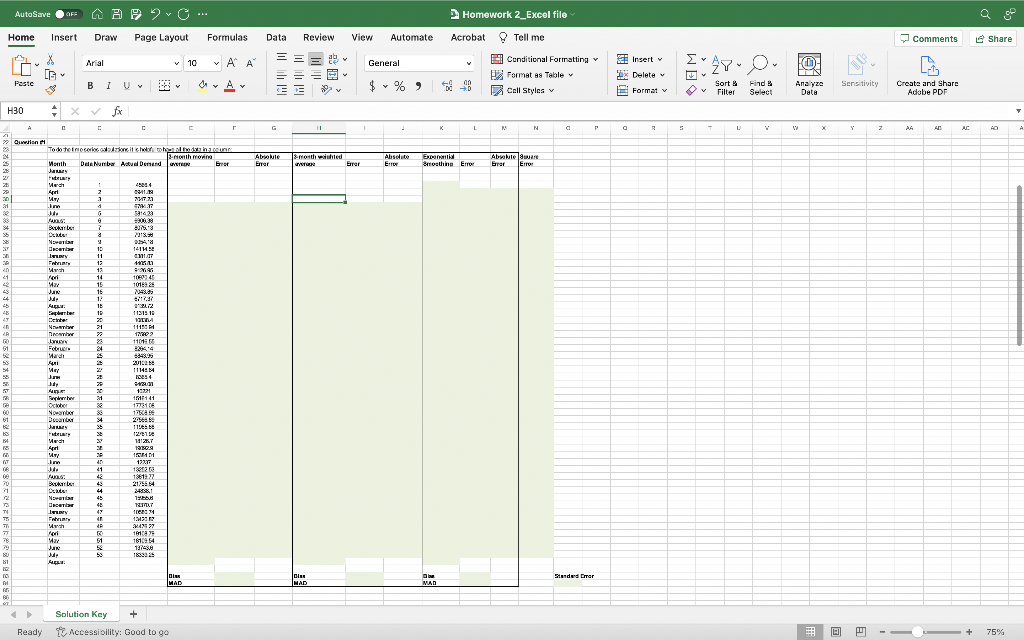
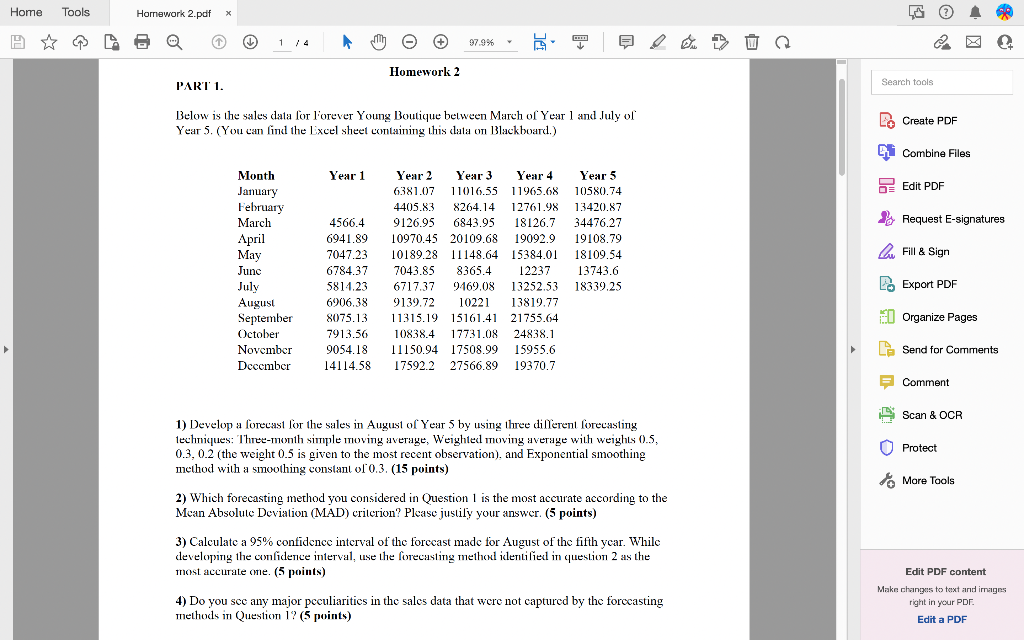
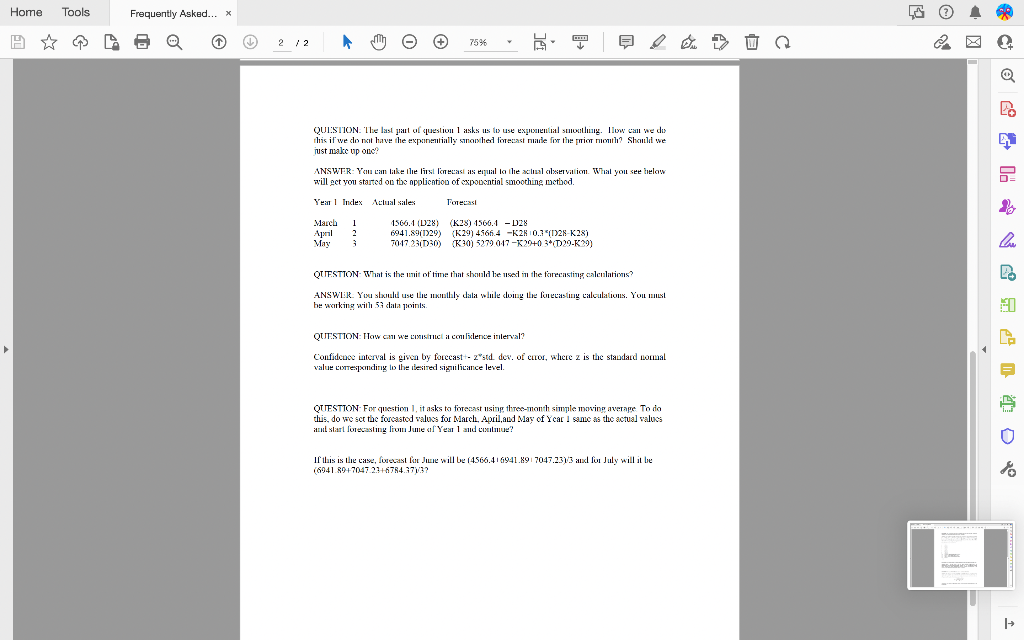
1. Develop a forecast for the sales in August of Year 5 by using three different forecasting techniques: Three-month simple moving average, Weighted moving average with weights 0.5, 0.3, 0.2 (the weight 0.5 is given to the most recent observation), and Exponential smoothing method with a smoothing constant of 0.3.
2. Which forecasting method you considered in Question 1 is the most accurate according to the Mean Absolute Deviation (MAD) criterion? Please justify your answer.
3. Calculate a 95% confidence interval of the forecast made for August of the fifth year. While developing the confidence interval, use the forecasting method identified in question 2 as the most accurate one.
4. Do you see any major peculiarities in the sales data that were not captured by the forecasting methods in Question 1?
Question \#1 To do the time series calculations it is helpful to have all the data in a column: : Below is the sales data for l'orever Young Boutique between Mareh of Year 1 and July of Create PDF Year 5. (You can find the Lixel sheet containing this data on l3lackboard.) Combine Files Edit PDF B) Request E-signatures Fill \& Sign Export PDF Organize Pages Send for Comments Comment Scan \& OCR 1) Develop a forecast for the sales in August of Year 5 by using three diflerent forecasting 1echmiques: Three-month simple moving average, Weighted moving average with weighLs 0.5 , 0.3,0.2 (the weight 0.5 is given to the most recent observation). and Exponential smoothing method with a smoothing constant of 0.3. (15 points) 2) Which forecasting method you considered in Question 1 is the most accurate according to the Mean Absolute Deviation (MAD) criterion? Please justily your answer. (5 points) 3) Calculate a 95% confidence interval of the forecast made for August of the fifth year. While developirg the confidence interval, use the forecasting methosl icletitilied in question 2 as the most accurate one. (5 points) Edit PDF content Make changes to text and irnages 4) Do you see any major peculiarities in the sales data that were not captured by the forecasting right in your PDF. methods in Question 1? (5 points) Edit a PDF QUESTION: How do we figure out what the "acrual" sales are? I am askine this coestion as cadculating bias and mesan absolute deviativa tuse actual dati. ANSWER- You are slready given the actual sales data tant had been collected beruece March of Year 1 and July of Yean 5. The data you see beee are the same as in the Lixoel file and these are the aciual sales. You need ts otginize lhe diala youmsell is iko lisecisitimg. Tow can you da lhat? Copy and paste all of the data into oec olimn aod eall it the sptual sales columu (PTense follos what umbtors 1 use by lookiog at the assiguiocnt shect): Tnime of tho rhemvatinns Artul Snles QTTSTTON- Ts the secmi question an opiisin quastion ar is there ane right inswer in this case? QAAD). Therore, you should ca]culate MAD for crery techique givec in onestion 1 and suggest the ouc with minimun M.AD as the solution of uestion 2. QUT.STION: Is the mean atisolule devialioxi ssine as the slandard deviation? ANSWEt: NO. IJease soc the sotion of FOLMULA titVItW at the back of the "forceasting" calculate the stamiatd emro of estimate, we first calculate the emo quare and then take the sum of xpares over the mumher of vhservations minus 2 . That is S=n2i=1(yiYi)2 Al:cmarizely, vou can uac tac approximate relation betoocn MLD and stasdard deriation in the lectue slides. this if we do not have the exponeatially snomhed fore:sst niale for the prio month? Should we iust nsale up one? zill get you started ou the apolicatiou of expountial smoothing metiod. QIT.STTON- What is the unit of time that shauld ke nset in the forecasting, calculations? ANSWLik. You sbould use Lhe monthly dala wlile doing the fonecaslimg calculations. You unst be warking with 5. daita points. QUT.STTON: How can we coxishucl it conlijlence inlerval? Confideuce iaterval is gisca by forecast 2 itd des. of curor, where z is the staudard homal value comtesponding to the llesired siscuiliciance level. Question \#1 To do the time series calculations it is helpful to have all the data in a column: : Below is the sales data for l'orever Young Boutique between Mareh of Year 1 and July of Create PDF Year 5. (You can find the Lixel sheet containing this data on l3lackboard.) Combine Files Edit PDF B) Request E-signatures Fill \& Sign Export PDF Organize Pages Send for Comments Comment Scan \& OCR 1) Develop a forecast for the sales in August of Year 5 by using three diflerent forecasting 1echmiques: Three-month simple moving average, Weighted moving average with weighLs 0.5 , 0.3,0.2 (the weight 0.5 is given to the most recent observation). and Exponential smoothing method with a smoothing constant of 0.3. (15 points) 2) Which forecasting method you considered in Question 1 is the most accurate according to the Mean Absolute Deviation (MAD) criterion? Please justily your answer. (5 points) 3) Calculate a 95% confidence interval of the forecast made for August of the fifth year. While developirg the confidence interval, use the forecasting methosl icletitilied in question 2 as the most accurate one. (5 points) Edit PDF content Make changes to text and irnages 4) Do you see any major peculiarities in the sales data that were not captured by the forecasting right in your PDF. methods in Question 1? (5 points) Edit a PDF QUESTION: How do we figure out what the "acrual" sales are? I am askine this coestion as cadculating bias and mesan absolute deviativa tuse actual dati. ANSWER- You are slready given the actual sales data tant had been collected beruece March of Year 1 and July of Yean 5. The data you see beee are the same as in the Lixoel file and these are the aciual sales. You need ts otginize lhe diala youmsell is iko lisecisitimg. Tow can you da lhat? Copy and paste all of the data into oec olimn aod eall it the sptual sales columu (PTense follos what umbtors 1 use by lookiog at the assiguiocnt shect): Tnime of tho rhemvatinns Artul Snles QTTSTTON- Ts the secmi question an opiisin quastion ar is there ane right inswer in this case? QAAD). Therore, you should ca]culate MAD for crery techique givec in onestion 1 and suggest the ouc with minimun M.AD as the solution of uestion 2. QUT.STION: Is the mean atisolule devialioxi ssine as the slandard deviation? ANSWEt: NO. IJease soc the sotion of FOLMULA titVItW at the back of the "forceasting" calculate the stamiatd emro of estimate, we first calculate the emo quare and then take the sum of xpares over the mumher of vhservations minus 2 . That is S=n2i=1(yiYi)2 Al:cmarizely, vou can uac tac approximate relation betoocn MLD and stasdard deriation in the lectue slides. this if we do not have the exponeatially snomhed fore:sst niale for the prio month? Should we iust nsale up one? zill get you started ou the apolicatiou of expountial smoothing metiod. QIT.STTON- What is the unit of time that shauld ke nset in the forecasting, calculations? ANSWLik. You sbould use Lhe monthly dala wlile doing the fonecaslimg calculations. You unst be warking with 5. daita points. QUT.STTON: How can we coxishucl it conlijlence inlerval? Confideuce iaterval is gisca by forecast 2 itd des. of curor, where z is the staudard homal value comtesponding to the llesired siscuiliciance level
Step by Step Solution
There are 3 Steps involved in it

Get step-by-step solutions from verified subject matter experts