

Question: Please answer the five questions in the attached image 1. In the table below we see the components of GDP (in percent of GDP) for
Please answer the five questions in the attached image
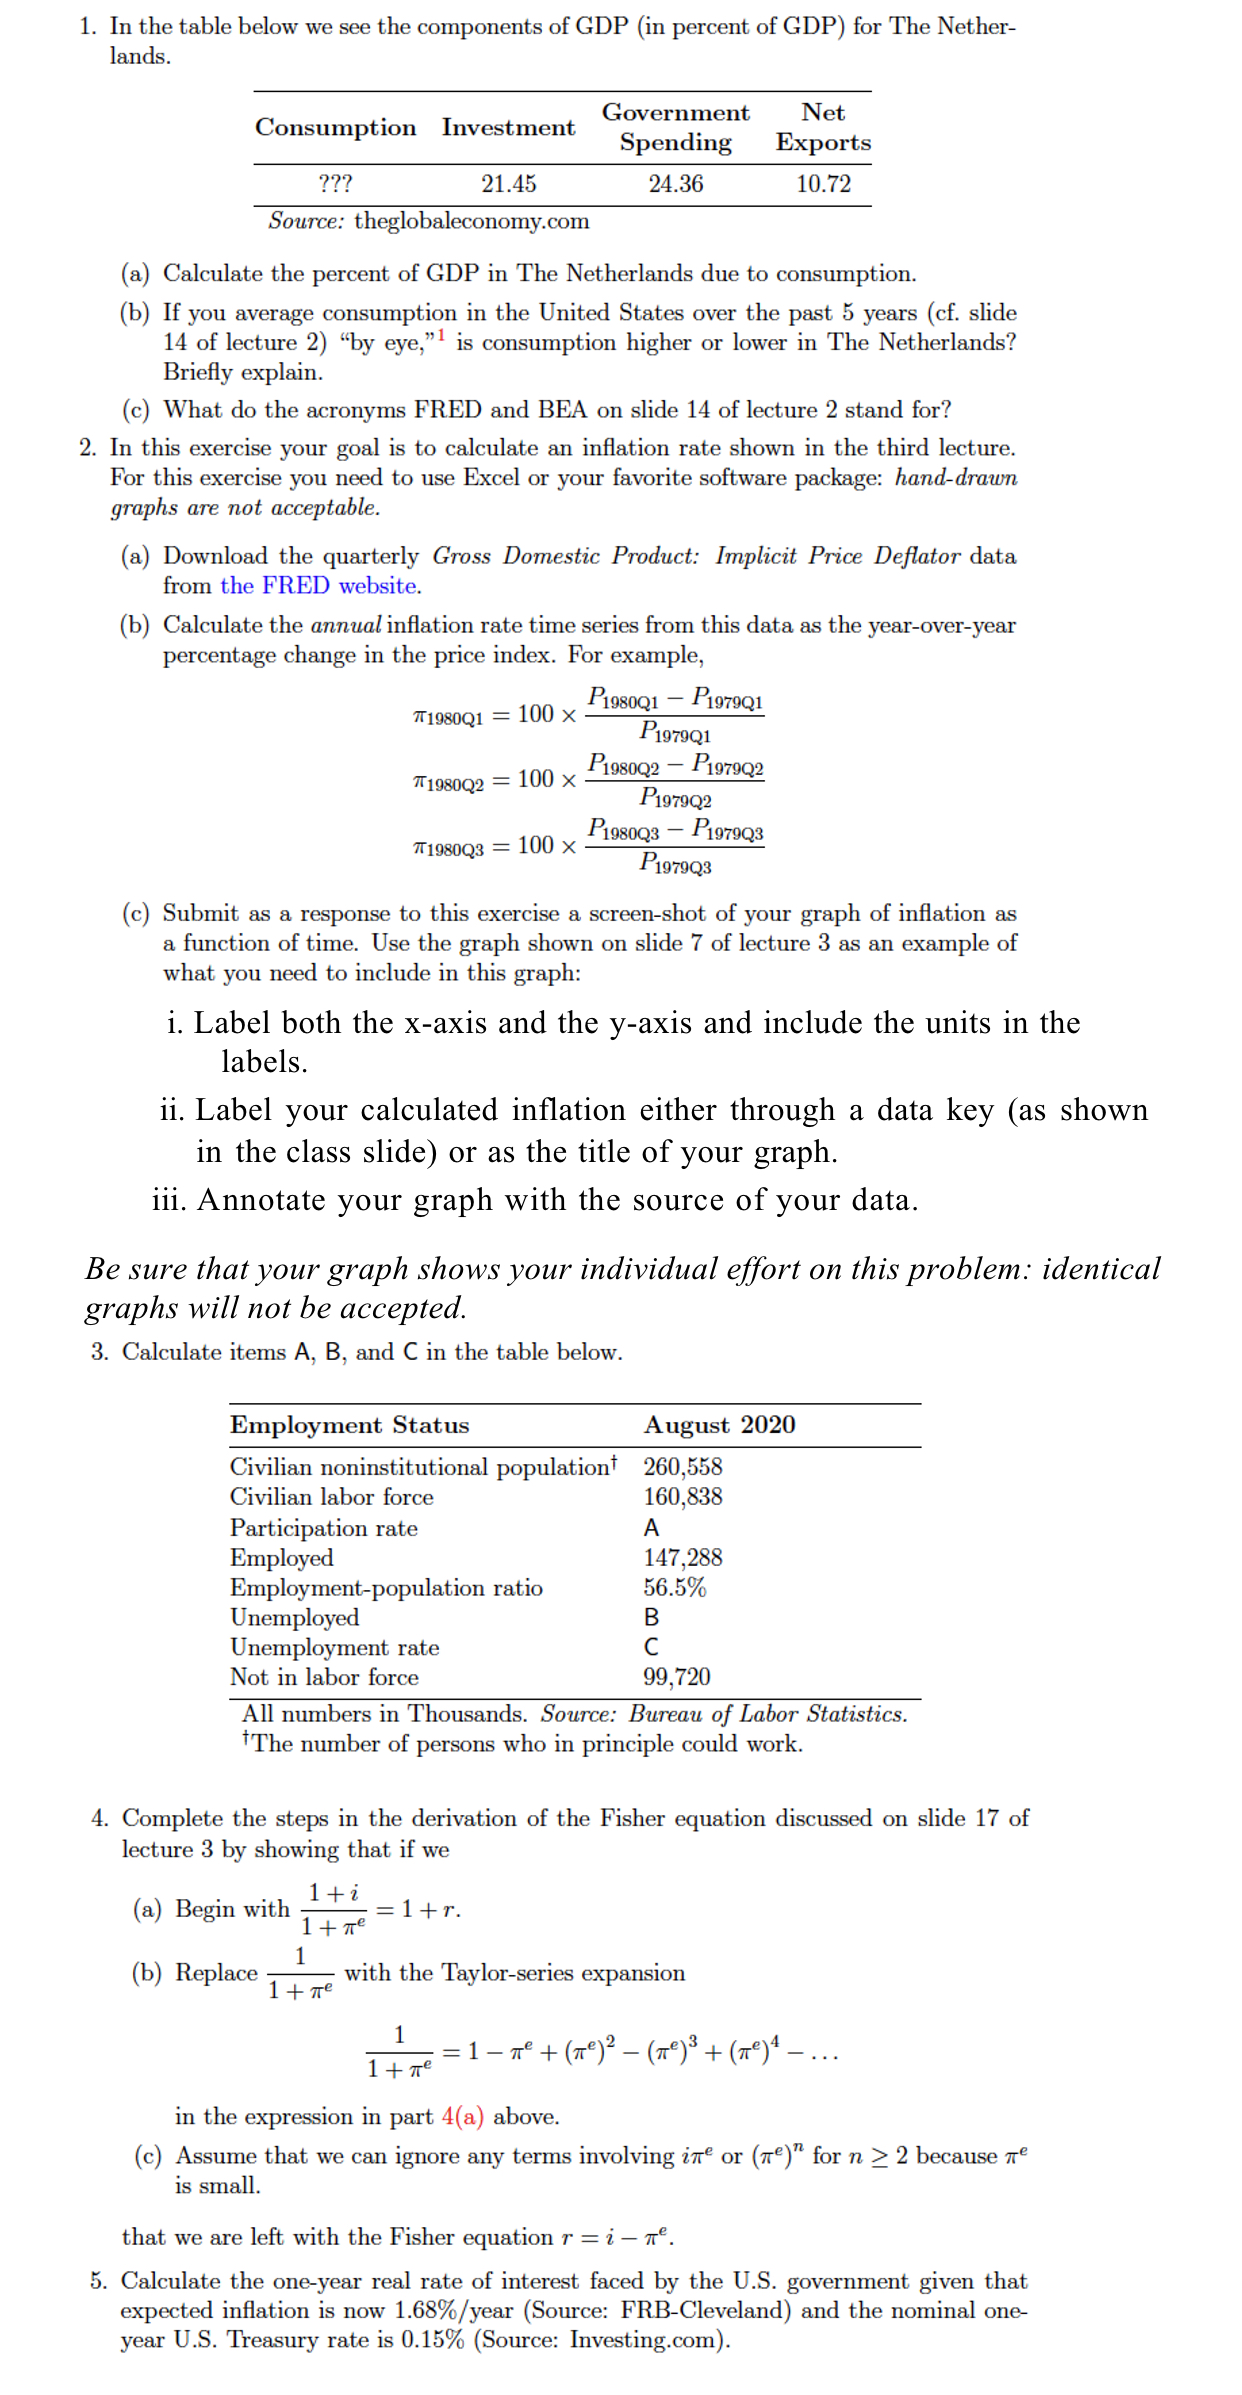
1. In the table below we see the components of GDP (in percent of GDP) for The Nether- lands. Consumption Investment Government Net Spending Exports ??? 21.45 24.36 10.72 Source: theglobaleconomy.com (a) Calculate the percent of GDP in The Netherlands due to consumption. (b) If you average consumption in the United States over the past 5 years (cf. slide 14 of lecture 2) "by eye," is consumption higher or lower in The Netherlands? Briefly explain. (c) What do the acronyms FRED and BEA on slide 14 of lecture 2 stand for? 2. In this exercise your goal is to calculate an inflation rate shown in the third lecture. For this exercise you need to use Excel or your favorite software package: hand-drawn graphs are not acceptable. (a) Download the quarterly Gross Domestic Product: Implicit Price Deflator data from the FRED website. (b) Calculate the annual inflation rate time series from this data as the year-over-year percentage change in the price index. For example, 71980Q1 = 100 x P1980Q1 - P1979Q1 P1979Q1 7 1980Q2 = 100 x P1980Q2 - P1979Q2 P1979Q2 7 1980Q3 = 100 x P1980Q3 - P1979Q3 P1979Q3 (c) Submit as a response to this exercise a screen-shot of your graph of inflation as a function of time. Use the graph shown on slide 7 of lecture 3 as an example of what you need to include in this graph: i. Label both the x-axis and the y-axis and include the units in the labels. ii. Label your calculated inflation either through a data key (as shown in the class slide) or as the title of your graph. iii. Annotate your graph with the source of your data. Be sure that your graph shows your individual effort on this problem: identical graphs will not be accepted 3. Calculate items A, B, and C in the table below. Employment Status August 2020 Civilian noninstitutional population 260,558 Civilian labor force 160,838 Participation rate A Employed 147,288 Employment-population ratio 56.5% Unemployed B Unemployment rate C Not in labor force 99,720 All numbers in Thousands. Source: Bureau of Labor Statistics. The number of persons who in principle could work. 4. Complete the steps in the derivation of the Fisher equation discussed on slide 17 of lecture 3 by showing that if we (a) Begin with 1+i 1 + me =1+r. (b) Replace 1 1 fare with the Taylor-series expansion 1 + me = 1 - me + ( 7 ) 2 - ( Te ) 3 + ( Te ) 4 - ... in the expression in part 4(a) above. (c) Assume that we can ignore any terms involving in or (Te)" for n 2 2 because Tre is small. that we are left with the Fisher equation r = i - me. 5. Calculate the one-year real rate of interest faced by the U.S. government given that expected inflation is now 1.68%/year (Source: FRB-Cleveland) and the nominal one- year U.S. Treasury rate is 0.15% (Source: Investing.com)
Step by Step Solution
There are 3 Steps involved in it

Get step-by-step solutions from verified subject matter experts