Question: Please answer the following Excel Problems. I have uploaded the Problem as a PDF and provided the supporting data for problem 1 and 2. Thank
Please answer the following Excel Problems. I have uploaded the Problem as a PDF and provided the supporting data for problem 1 and 2. Thank you! 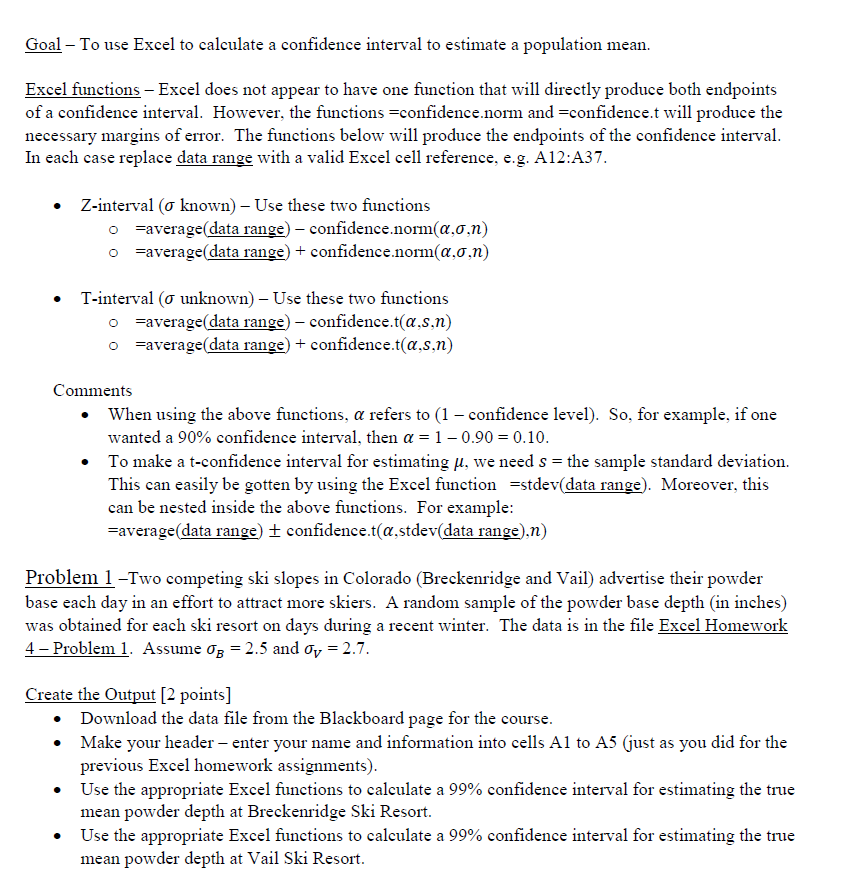
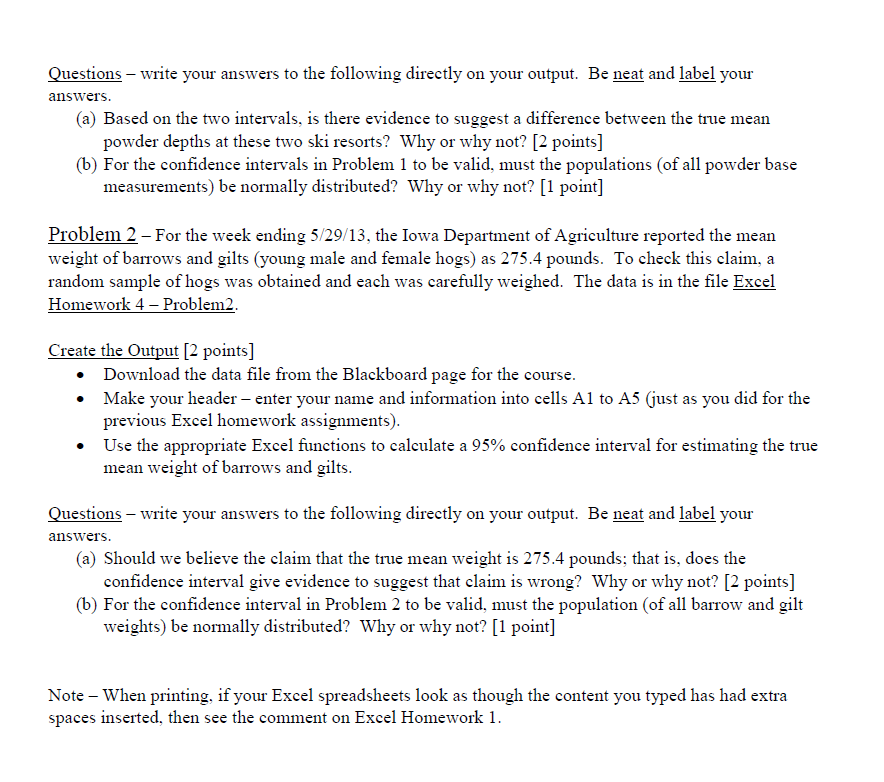
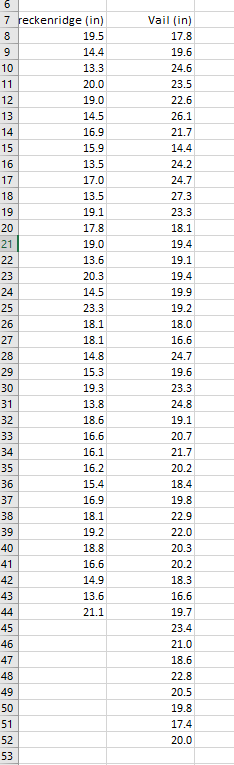
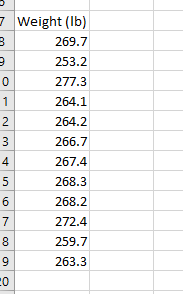
Goal To use Excel to calculate a confidence interval to estimate a population mean. Excel functions Excel does not appear to have one function that will directly produce both endpoints of a confidence interval. However, the functions =confidence.norm and Econfidence.t will produce the necessary margins of error. The functions below will produce the endpoints of the confidence interval. In each case replace data range with a valid Excel cell reference, e.g. A12:A37. Z-interval (o known) - Use these two functions o=average(data range) - confidence.norm(a,0,n) o Saverage(data range) + confidence.norm(a,0,n) T-interval (o unknown) - Use these two functions =average( data range) - confidence.t(a.s,n) =average(data range) + confidence.t(a,s,n) Comments When using the above functions, a refers to (1 confidence level). So, for example, if one wanted a 90% confidence interval, then a = 1 -0.90 = 0.10. To make a t-confidence interval for estimating Li, we need s = the sample standard deviation. This can easily be gotten by using the Excel function=stdev(data range). Moreover, this can be nested inside the above functions. For example: =average (data range) confidence.t(a,stdev(data range),n) Problem 1 -Two competing ski slopes in Colorado (Breckenridge and Vail) advertise their powder base each day in an effort to attract more skiers. A random sample of the powder base depth (in inches) was obtained for each ski resort on days during a recent winter. The data is in the file Excel Homework 4 - Problem 1. Assume OB = 2.5 and Oy = 2.7. Create the Output (2 points] Download the data file from the Blackboard page for the course. Make your header enter your name and information into cells Al to A5 (just as you did for the previous Excel homework assignments). Use the appropriate Excel functions to calculate a 99% confidence interval for estimating the true mean powder depth at Breckenridge Ski Resort. Use the appropriate Excel functions to calculate a 99% confidence interval for estimating the true mean powder depth at Vail Ski Resort Questions - write your answers to the following directly on your output. Be neat and label your answers. (a) Based on the two intervals, is there evidence to suggest a difference between the true mean powder depths at these two ski resorts? Why or why not? [2 points] (b) For the confidence intervals in Problem 1 to be valid, must the populations (of all powder base measurements) be normally distributed? Why or why not? [1 point] Problem 2 - For the week ending 5/29/13, the Iowa Department of Agriculture reported the mean weight of barrows and gilts (young male and female hogs) as 275.4 pounds. To check this claim, a random sample of hogs was obtained and each was carefully weighed. The data is in the file Excel Homework 4 Problem2. Create the Output (2 points] Download the data file from the Blackboard page for the course. Make your header - enter your name and information into cells Al to A5 (just as you did for the previous Excel homework assignments). Use the appropriate Excel functions to calculate a 95% confidence interval for estimating the true mean weight of barrows and gilts. Questions write your answers to the following directly on your output. Be neat and label your answers. (a) Should we believe the claim that the true mean weight is 275.4 pounds; that is, does the confidence interval give evidence to suggest that claim is wrong? Why or why not? [2 points] (b) For the confidence interval in Problem 2 to be valid, must the population (of all barrow and gilt weights) be normally distributed? Why or why not? [1 point] Note When printing, if your Excel spreadsheets look as though the content you typed has had extra spaces inserted, then see the comment on Excel Homework 1. Vail (in) 6 7 reckenridge (in) 8 19.5 9 14.4 10 13.3 11 20.0 12 19.0 13 14.5 14 16.9 15 15.9 16 13.5 17 17.0 18 13.5 19 19.1 20 17.8 21 19.0 22 13.6 23 20.3 24 14.5 25 23.3 26 18.1 27 18.1 28 14.8 29 15.3 30 19.3 31 13.8 32 18.6 33 16.6 34 16.1 35 16.2 36 15.4 37 16.9 38 18.1 39 19.2 40 18.8 41 16.6 42 14.9 43 13.6 44 21.1 45 46 47 48 49 50 51 52 53 17.8 19.6 24.6 23.5 22.6 26.1 21.7 14.4 24.2 24.7 27.3 23.3 18.1 19.4 19.1 19.4 19.9 19.2 18.0 16.6 24.7 19.6 23.3 24.8 19.1 20.7 21.7 20.2 18.4 19.8 22.9 22.0 20.3 20.2 18.3 16.6 19.7 23.4 21.0 18.6 22.8 20.5 19.8 17.4 20.0 7 Weight (lb) 3 269.7 3 253.2 0 277.3 1 264.1 264.2 3 266.7 w N 4 5 6 267.4 268.3 268.2 272.4 259.7 263.3 7 8 9 20 Goal To use Excel to calculate a confidence interval to estimate a population mean. Excel functions Excel does not appear to have one function that will directly produce both endpoints of a confidence interval. However, the functions =confidence.norm and Econfidence.t will produce the necessary margins of error. The functions below will produce the endpoints of the confidence interval. In each case replace data range with a valid Excel cell reference, e.g. A12:A37. Z-interval (o known) - Use these two functions o=average(data range) - confidence.norm(a,0,n) o Saverage(data range) + confidence.norm(a,0,n) T-interval (o unknown) - Use these two functions =average( data range) - confidence.t(a.s,n) =average(data range) + confidence.t(a,s,n) Comments When using the above functions, a refers to (1 confidence level). So, for example, if one wanted a 90% confidence interval, then a = 1 -0.90 = 0.10. To make a t-confidence interval for estimating Li, we need s = the sample standard deviation. This can easily be gotten by using the Excel function=stdev(data range). Moreover, this can be nested inside the above functions. For example: =average (data range) confidence.t(a,stdev(data range),n) Problem 1 -Two competing ski slopes in Colorado (Breckenridge and Vail) advertise their powder base each day in an effort to attract more skiers. A random sample of the powder base depth (in inches) was obtained for each ski resort on days during a recent winter. The data is in the file Excel Homework 4 - Problem 1. Assume OB = 2.5 and Oy = 2.7. Create the Output (2 points] Download the data file from the Blackboard page for the course. Make your header enter your name and information into cells Al to A5 (just as you did for the previous Excel homework assignments). Use the appropriate Excel functions to calculate a 99% confidence interval for estimating the true mean powder depth at Breckenridge Ski Resort. Use the appropriate Excel functions to calculate a 99% confidence interval for estimating the true mean powder depth at Vail Ski Resort Questions - write your answers to the following directly on your output. Be neat and label your answers. (a) Based on the two intervals, is there evidence to suggest a difference between the true mean powder depths at these two ski resorts? Why or why not? [2 points] (b) For the confidence intervals in Problem 1 to be valid, must the populations (of all powder base measurements) be normally distributed? Why or why not? [1 point] Problem 2 - For the week ending 5/29/13, the Iowa Department of Agriculture reported the mean weight of barrows and gilts (young male and female hogs) as 275.4 pounds. To check this claim, a random sample of hogs was obtained and each was carefully weighed. The data is in the file Excel Homework 4 Problem2. Create the Output (2 points] Download the data file from the Blackboard page for the course. Make your header - enter your name and information into cells Al to A5 (just as you did for the previous Excel homework assignments). Use the appropriate Excel functions to calculate a 95% confidence interval for estimating the true mean weight of barrows and gilts. Questions write your answers to the following directly on your output. Be neat and label your answers. (a) Should we believe the claim that the true mean weight is 275.4 pounds; that is, does the confidence interval give evidence to suggest that claim is wrong? Why or why not? [2 points] (b) For the confidence interval in Problem 2 to be valid, must the population (of all barrow and gilt weights) be normally distributed? Why or why not? [1 point] Note When printing, if your Excel spreadsheets look as though the content you typed has had extra spaces inserted, then see the comment on Excel Homework 1. Vail (in) 6 7 reckenridge (in) 8 19.5 9 14.4 10 13.3 11 20.0 12 19.0 13 14.5 14 16.9 15 15.9 16 13.5 17 17.0 18 13.5 19 19.1 20 17.8 21 19.0 22 13.6 23 20.3 24 14.5 25 23.3 26 18.1 27 18.1 28 14.8 29 15.3 30 19.3 31 13.8 32 18.6 33 16.6 34 16.1 35 16.2 36 15.4 37 16.9 38 18.1 39 19.2 40 18.8 41 16.6 42 14.9 43 13.6 44 21.1 45 46 47 48 49 50 51 52 53 17.8 19.6 24.6 23.5 22.6 26.1 21.7 14.4 24.2 24.7 27.3 23.3 18.1 19.4 19.1 19.4 19.9 19.2 18.0 16.6 24.7 19.6 23.3 24.8 19.1 20.7 21.7 20.2 18.4 19.8 22.9 22.0 20.3 20.2 18.3 16.6 19.7 23.4 21.0 18.6 22.8 20.5 19.8 17.4 20.0 7 Weight (lb) 3 269.7 3 253.2 0 277.3 1 264.1 264.2 3 266.7 w N 4 5 6 267.4 268.3 268.2 272.4 259.7 263.3 7 8 9 20


