

Question: Please answer the following question: 4. The boxplots below summarize the distribution of SAT verbal and math scores among students at an upstate New York
Please answer the following question:
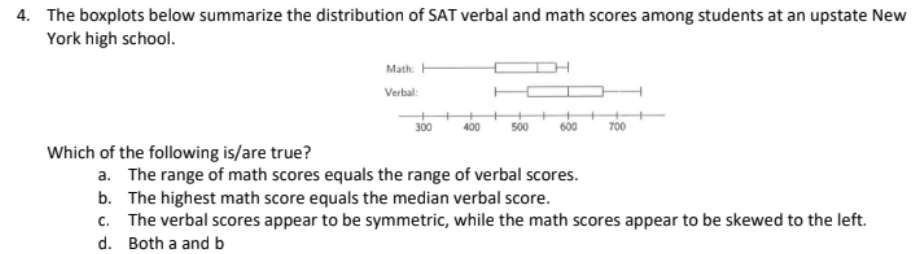
4. The boxplots below summarize the distribution of SAT verbal and math scores among students at an upstate New York high school. Math: Verbal: 300 400 500 600 700 Which of the following is/are true? a. The range of math scores equals the range of verbal scores. b. The highest math score equals the median verbal score. c. The verbal scores appear to be symmetric, while the math scores appear to be skewed to the left. d. Both a and b
Step by Step Solution
There are 3 Steps involved in it
1 Expert Approved Answer
Step: 1 Unlock

Question Has Been Solved by an Expert!
Get step-by-step solutions from verified subject matter experts
Step: 2 Unlock
Step: 3 Unlock