

Question: Please answer the following: Question 5 0.5 pts A study investigated how the content of vitamin A in carrots is affected by the time being
Please answer the following:
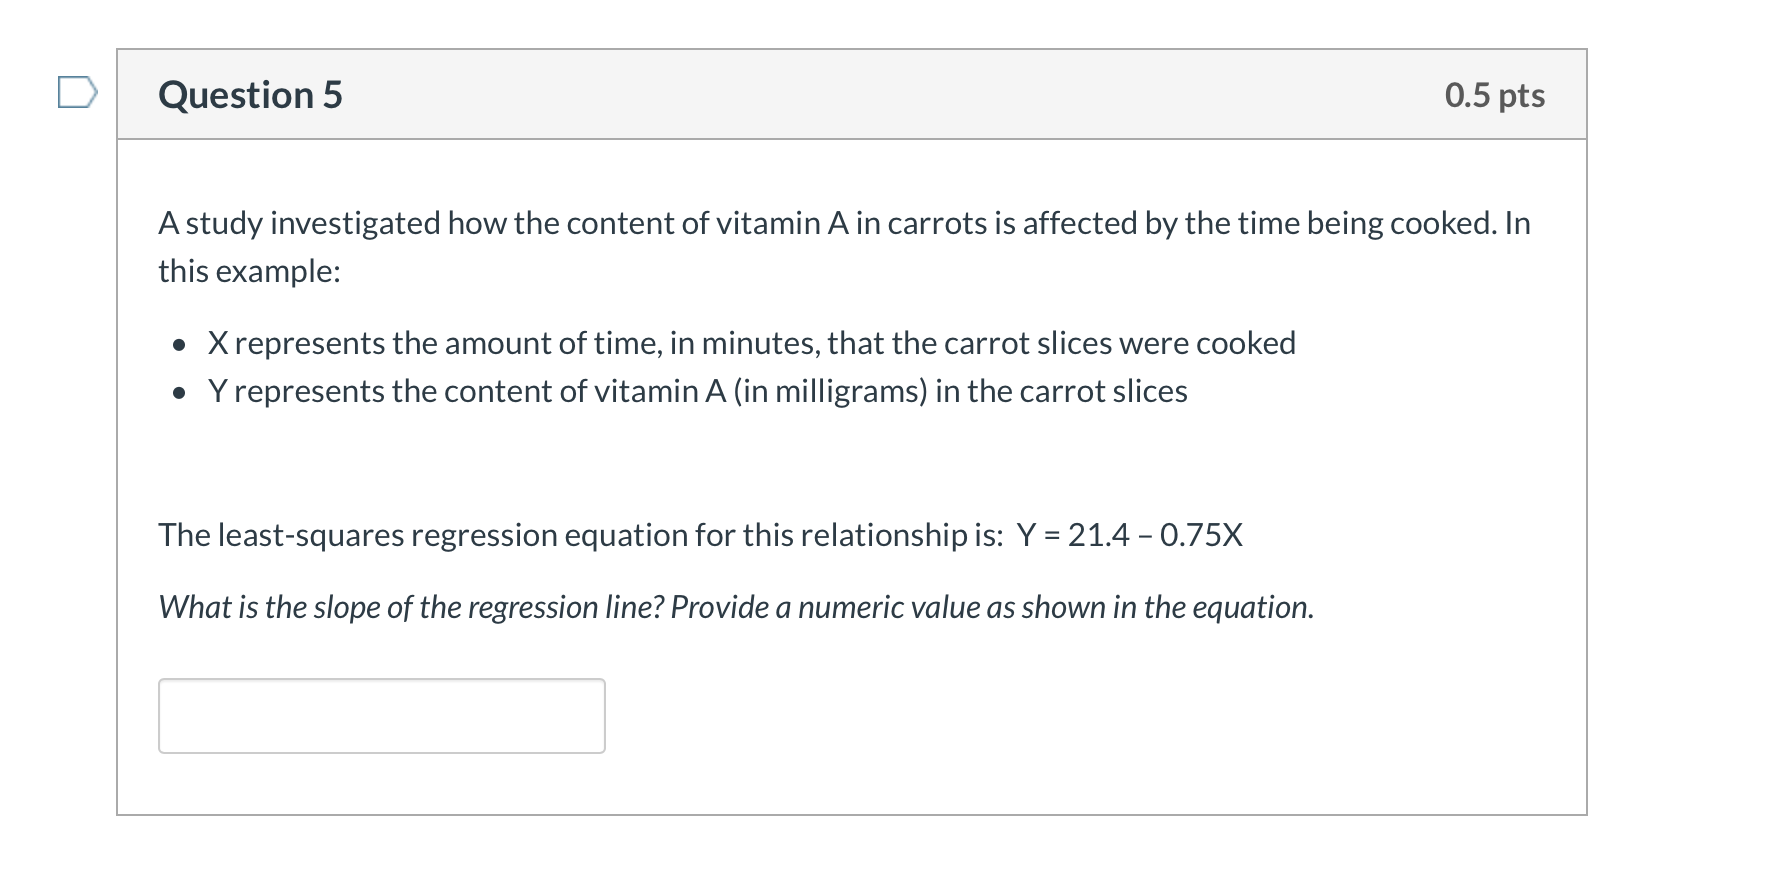
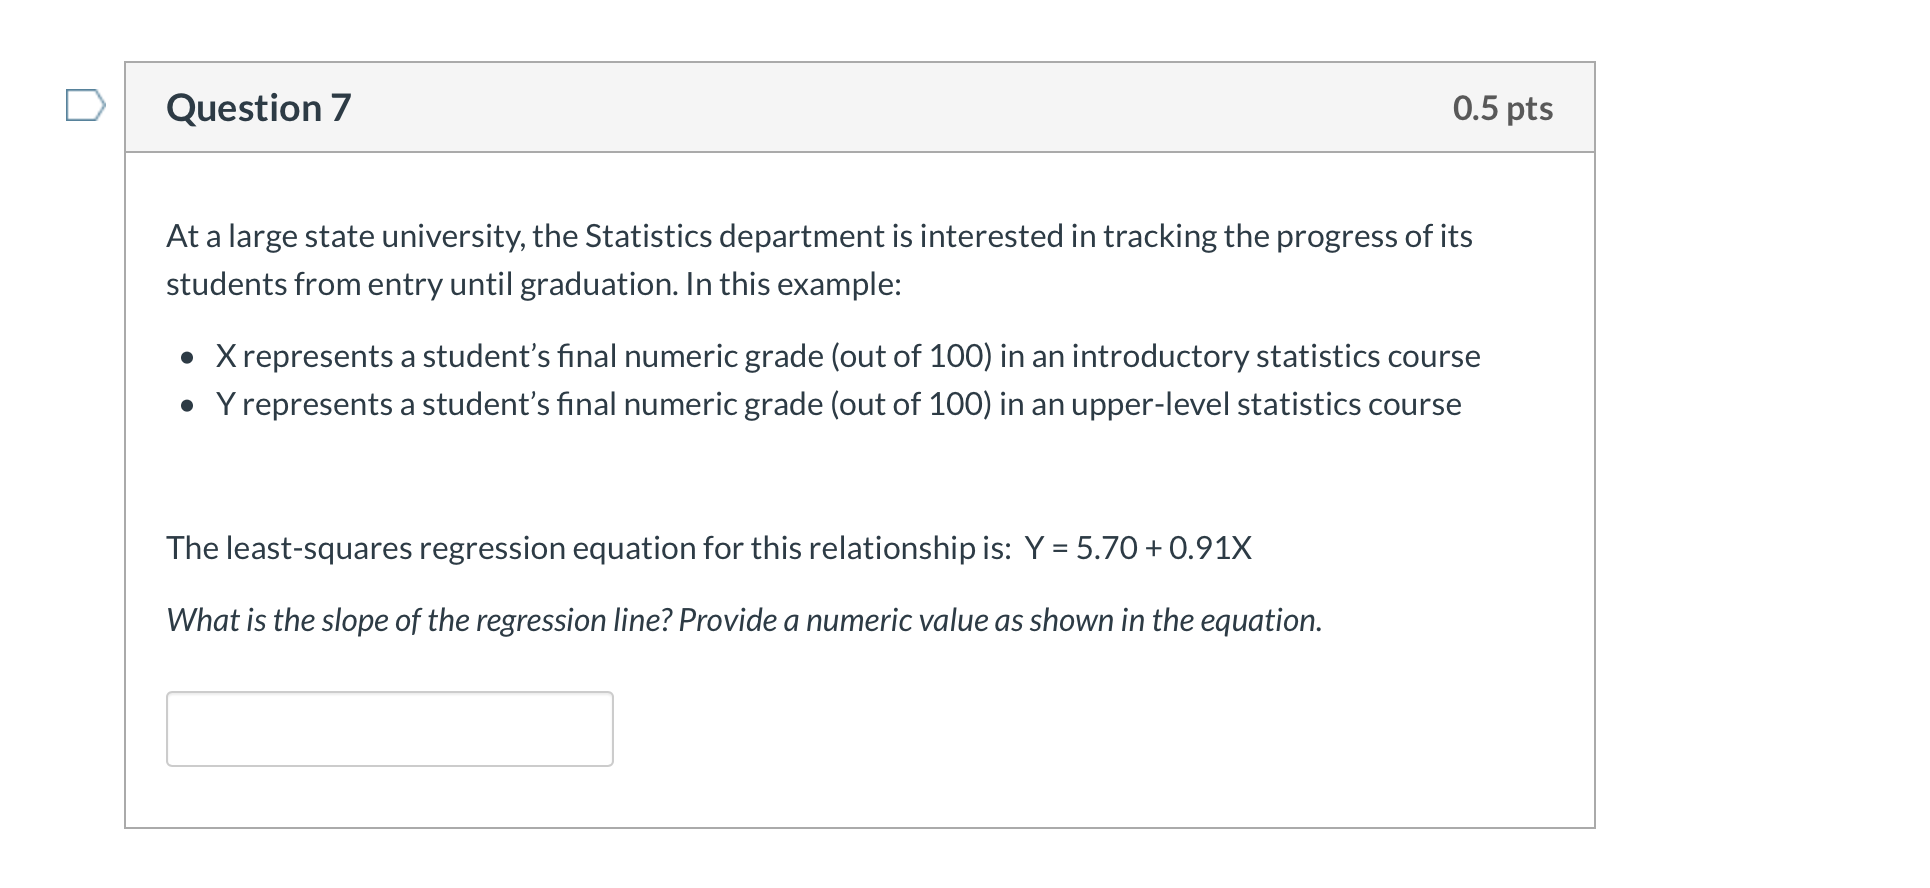
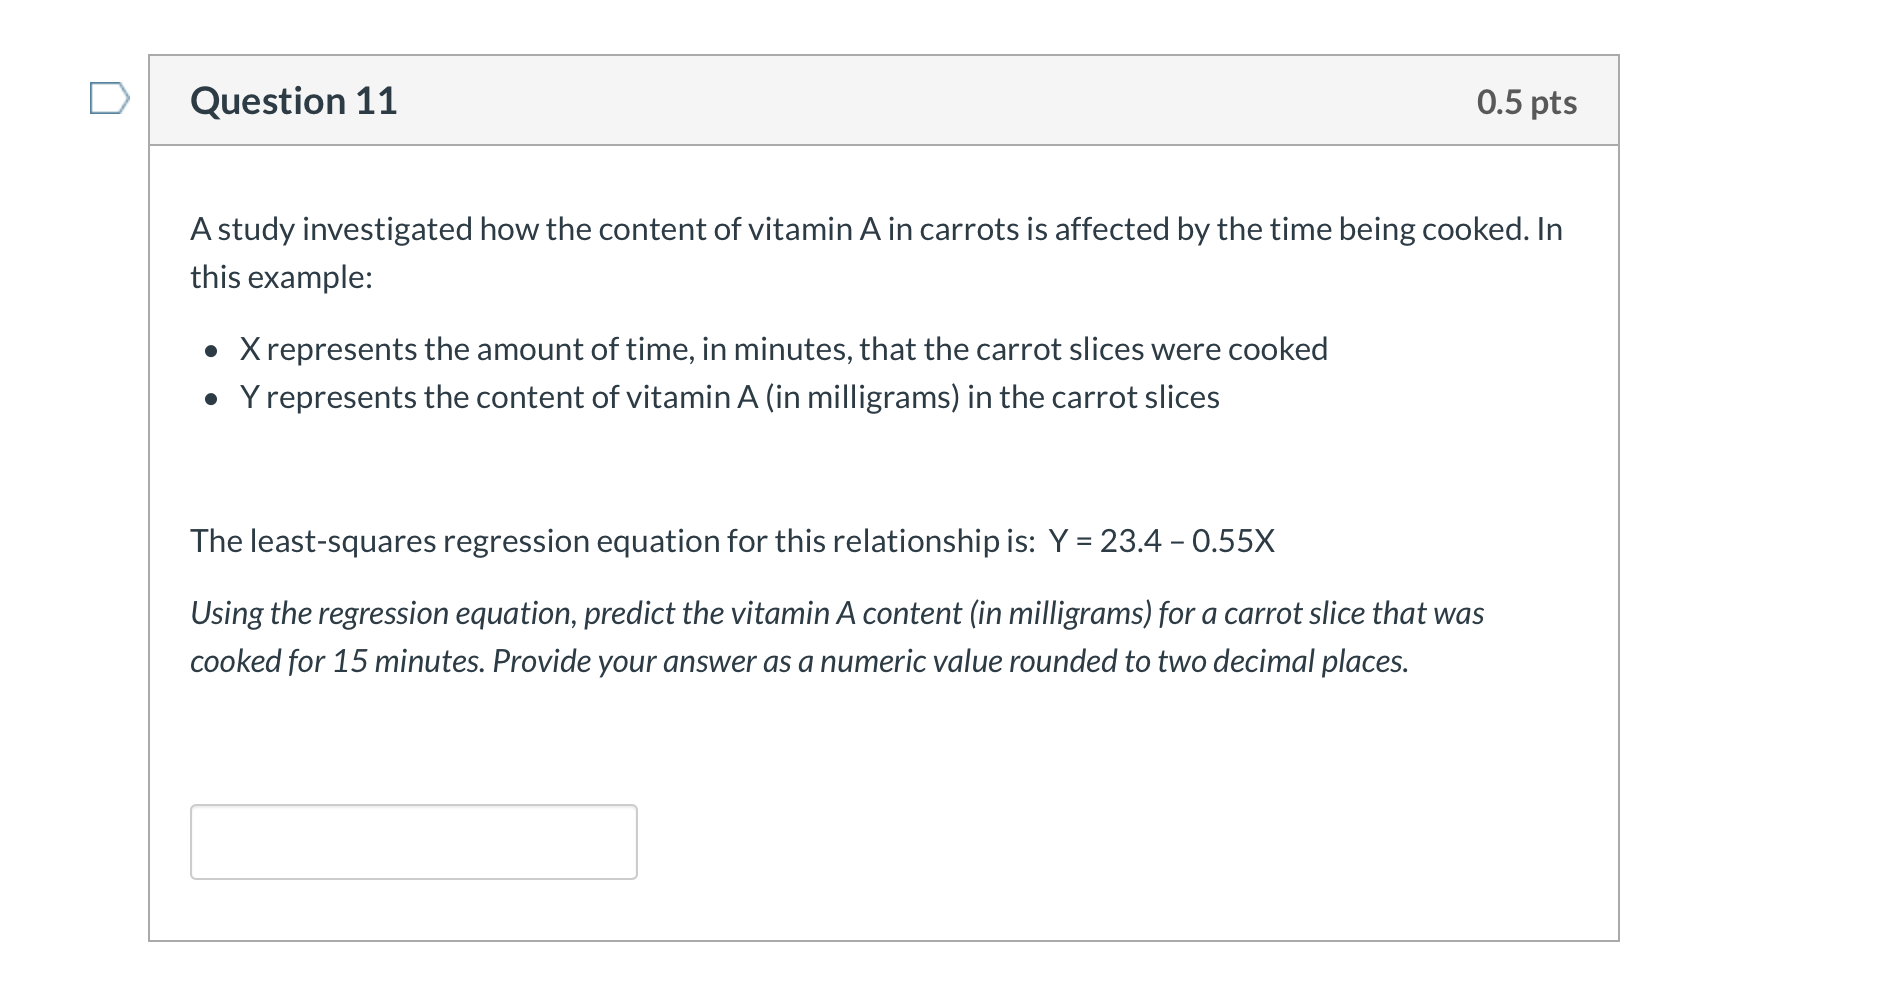
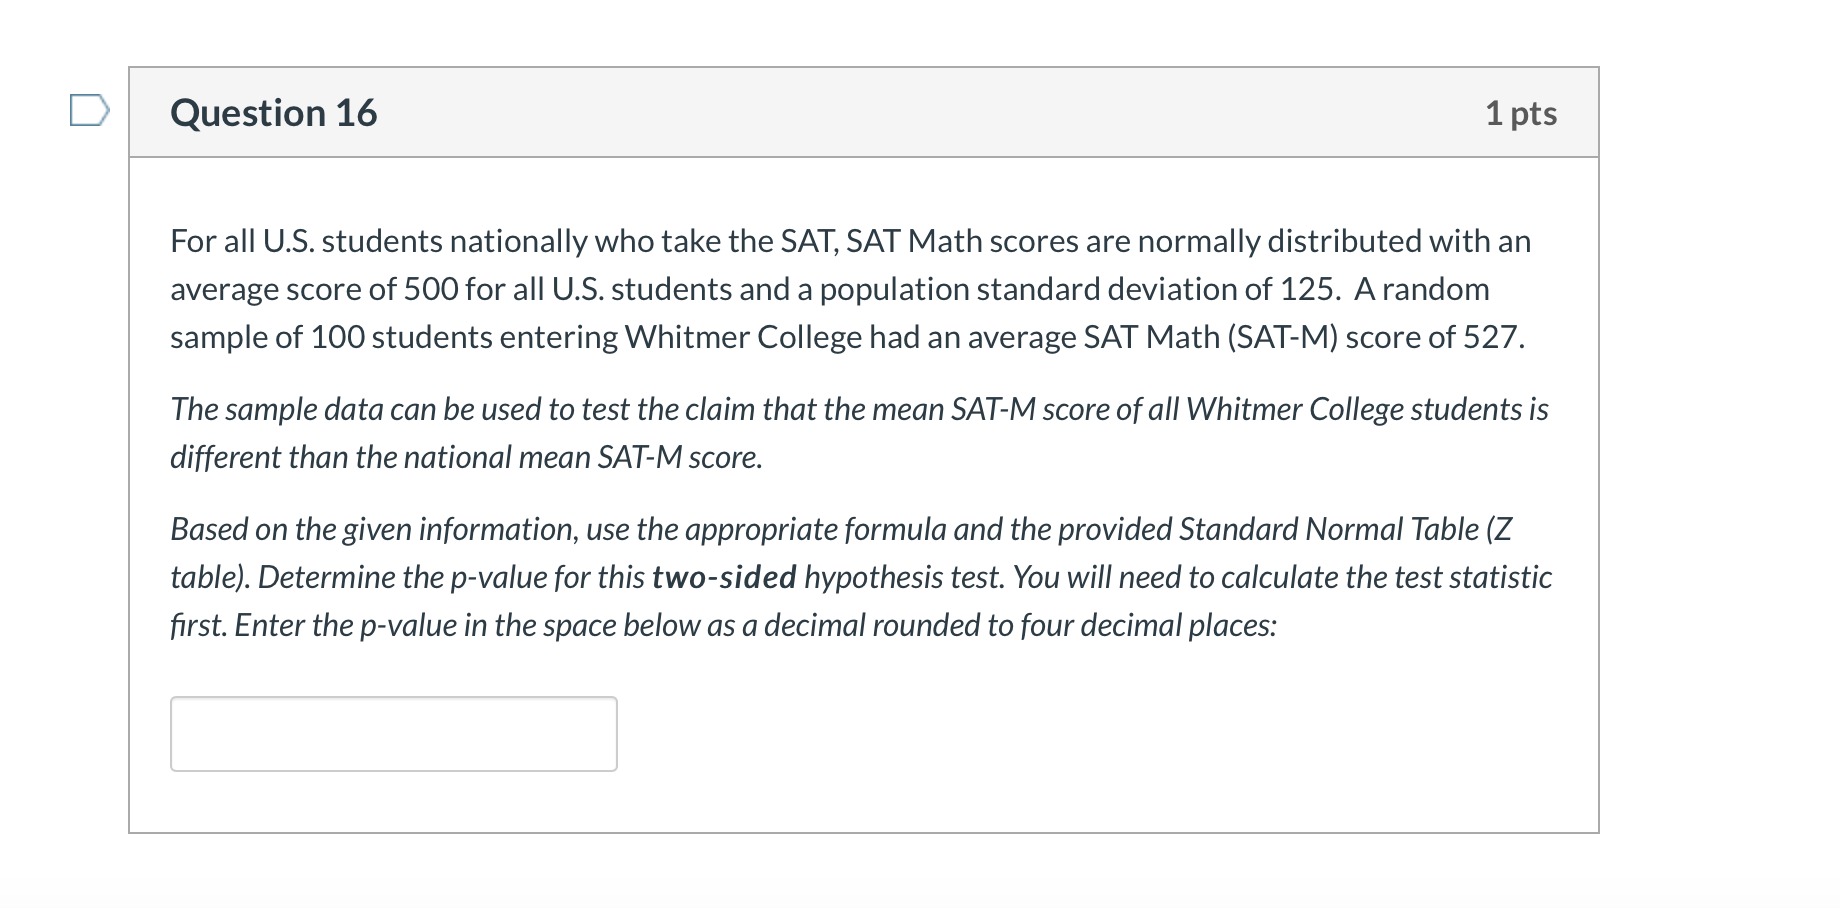
Question 5 0.5 pts A study investigated how the content of vitamin A in carrots is affected by the time being cooked. In this example: 0 X represents the amount of time, in minutes, that the carrot slices were cooked 0 Y represents the content of vitamin A (in milligrams) in the carrot slices The least-squares regression equation for this relationship is: Y = 21.4 0.75X What is the slope of the regression line? Provide a numeric value as shown in the equation. Question 7 0.5 pts At a large state university, the Statistics department is interested in tracking the progress of its students from entry until graduation. In this example: a X represents a student's nal numeric grade {out of 100) in an introductory statistics course a Y represents a student's nal numeric grade (out of 100) in an upperlevel statistics course The least-squares regression equation for this relationship is: Y = 5.70 + 0.91X What is the slope of the regression line? Provide a numeric value as shown in the equation. Question 11 0.5 pts A study investigated how the content of vitamin A in carrots is affected by the time being cooked. In this example: . X represents the amount of time, in minutes, that the carrot slices were cooked . Y represents the content of vitamin A (in milligrams) in the carrot slices The least-squares regression equation for this relationship is: Y = 23.4 0.55X Using the regression equation, predict the vitamin A content (in milligrams) for a carrot slice that was cooked for 15 minutes. Provide your answer as a numeric value rounded to two decimal places. Question 16 1 pts For all US. students nationally who take the SAT, SAT Math scores are normally distributed with an average score of 500 for all US students and a population standard deviation of 125. A random sample of 100 students entering Whitmer College had an average SAT Math (SATM) score of 527. The sample data can be used to test the claim that the mean SAT-M score of all Whitmer College students is different than the national mean SAT-M score. Based on the given information, use the appropriate formula and the provided Standard Normal Table (2 table). Determine the p-value for this two-sided hypothesis test. You will need to calculate the test statistic first. Enter the p-value in the space below as a decimal rounded to four decimal places
Step by Step Solution
There are 3 Steps involved in it

Get step-by-step solutions from verified subject matter experts