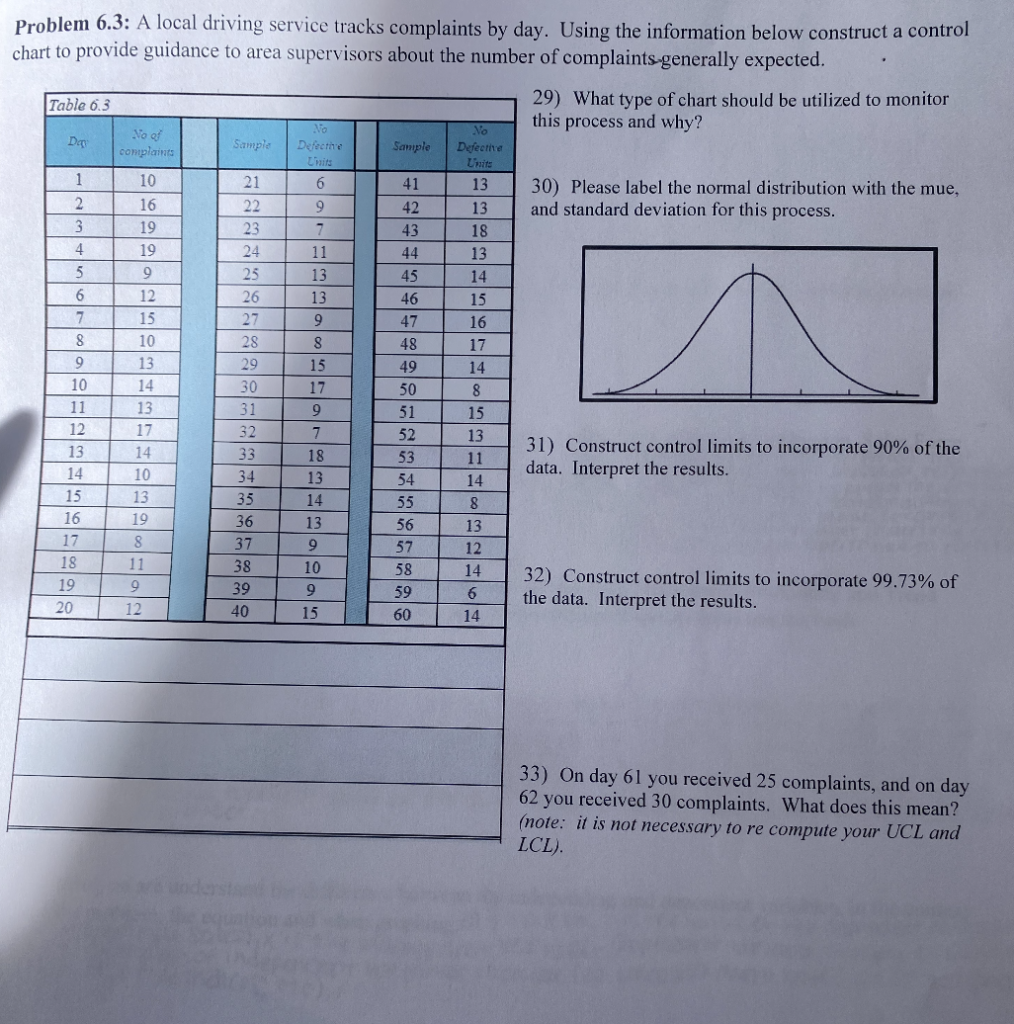
Question: PLEASE ANSWER THE FOLLOWING QUESTION AND SHOW WORK!!!! I need to know how to complete each part of the problem Problem 6.3: A local driving

PLEASE ANSWER THE FOLLOWING QUESTION AND SHOWPLEASE ANSWER THE FOLLOWING QUESTION AND SHOW WORK!!!! I need to know how to complete each part of the problem

Problem 6.3: A local driving service tracks complaints by day. Using the information below construct a control chart to provide guidance to area supervisors about the number of complaints generally expected. Table 6.3 29) What type of chart should be utilized to monitor this process and why? Day Samplo Sample Vo Defective Units 6 9 41 30) Please label the normal distribution with the mue, and standard deviation for this process. 7 1 2 3 4 5 6 7 8 9. 10 11 12 13 14 15 16 17 18 19 20 No of complaints 10 16 19 19 9 12 15 10 13 14 13 17 14 10 13 19 8 11 9 12 21 22 23 24 25 26 27 28 29 30 31 32 33 34 35 36 37 38 39 40 11 13 13 9 8 15 17 9 7 18 13 14 13 9 10 9 15 42 43 44 45 46 47 48 49 50 51 52 53 54 55 56 57 58 59 60 No Defecte Limits 13 13 18 13 14 15 16 17 14 8 15 13 11 14 8 13 12 14 6 14 31) Construct control limits to incorporate 90% of the data. Interpret the results. 32) Construct control limits to incorporate 99.73% of the data. Interpret the results. 33) On day 61 you received 25 complaints, and on day 62 you received 30 complaints. What does this mean? (note: it is not necessary to re compute your UCL and LCL)

Step by Step Solution

There are 3 Steps involved in it

1 Expert Approved Answer
Step: 1 Unlock blur-text-image
Question Has Been Solved by an Expert!

Get step-by-step solutions from verified subject matter experts

Step: 2 Unlock
Step: 3 Unlock

Students Have Also Explored These Related General Management Questions!