

Question: Please answer the following question The data are also reproduced here: Hourly Years of Wage Education 26.37 13 41.27 14 22.60 13 14.84 16 11.20

Please answer the following question
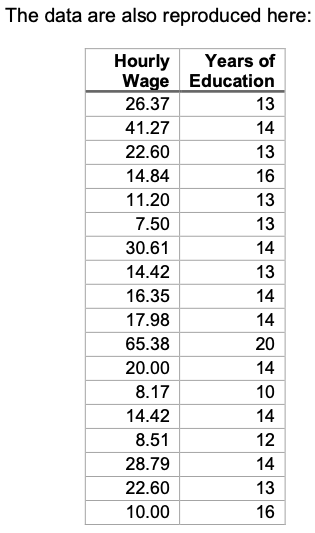

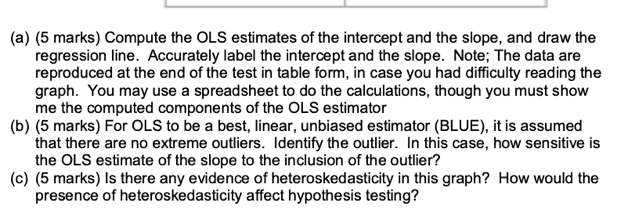
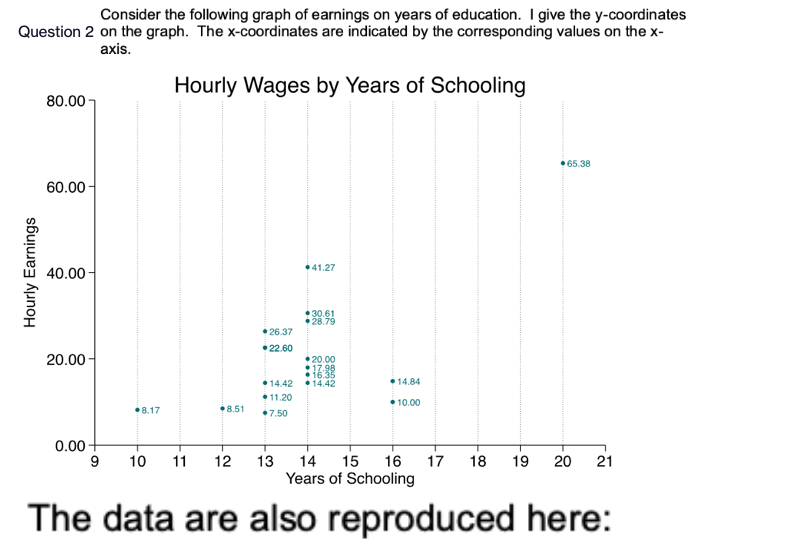
The data are also reproduced here: Hourly Years of Wage Education 26.37 13 41.27 14 22.60 13 14.84 16 11.20 13 7.50 13 30.61 14 14.42 13 16.35 14 17.98 14 65.38 20 20.00 14 8.17 10 14.42 14 8.51 12 28.79 14 22.60 13 10.00 16Consider the following graph of earnings on years of education. I give the y-coordinates Question 2 on the graph. The x-coordinates are indicated by the corresponding values on the x- axis. Hourly Wages by Years of Schooling 80.00- #65.38 60.00 #41.27 Hourly Earnings 40.00 .30.61 # 28.79 26.37 22.60 20.00 20.00 17.98 14.42 . 14.42 14.84 # 11.20 #10.00 #8.17 #8.51 $7.50 0.00- 9 10 11 12 13 14 15 16 17 18 19 20 21 Years of Schooling The data are also reproduced here:(a) (5 marks) Compute the OLS estimates of the intercept and the slope, and draw the regression line. Accurately label the intercept and the slope. Note; The data are reproduced at the end of the test in table form, in case you had difficulty reading the graph. You may use a spreadsheet to do the calculations, though you must show me the computed components of the OLS estimator (b) (5 marks) For OLS to be a best, linear, unbiased estimator (BLUE), it is assumed that there are no extreme outliers. Identify the outlier. In this case, how sensitive is the OLS estimate of the slope to the inclusion of the outlier? (c) (5 marks) Is there any evidence of heteroskedasticity in this graph? How would the presence of heteroskedasticity affect hypothesis testing
Step by Step Solution
There are 3 Steps involved in it

Get step-by-step solutions from verified subject matter experts