

Question: please answer the following question with proper steps in detail and proper significant figure if needed Refer to the titration curves for the strong acid
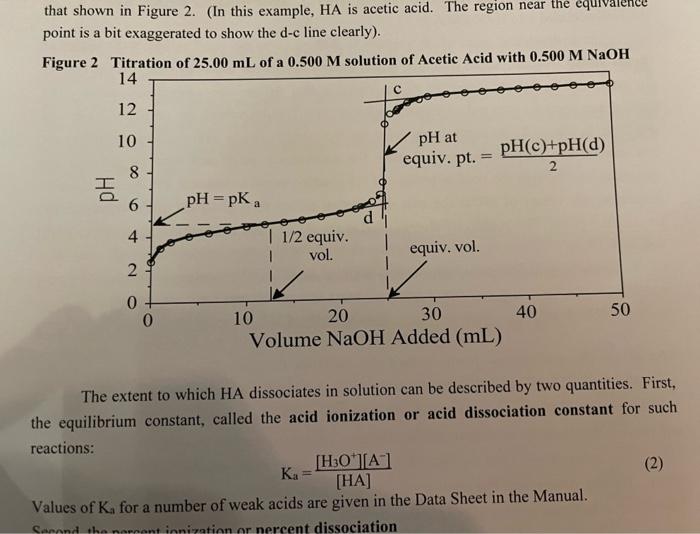
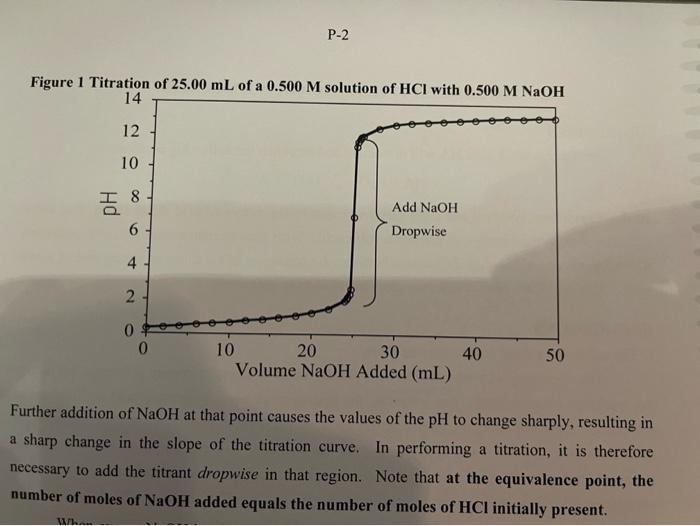
Refer to the titration curves for the strong acid HCl (Figure 1, p. P-2) and for the weak acid acetic acid (Figure 2, p. P-3). From the Table on p. P-5, select two acid-base indicators that would be suitable for replicate titrations of HCl with NaOH but would NOT be suitable for acetic acid with NaOH. ( 0.5 marks) point is a bit exaggerated to show the d-c line clearly). Figure 2 Titration of 25.00mL of a 0.500M solution of Acetic Acid with 0.500MNaOH The extent to which HA dissociates in solution can be described by two quantities. First, the equilibrium constant, called the acid ionization or acid dissociation constant for such reactions: Ka=[HA][H3O+][A] Values of K3 for a number of weak acids are given in the Data Sheet in the Manual. Figure 1 Titration of 25.00mL of a 0.500M Further addition of NaOH at that point causes the values of the pH to change sharply, resulting in a sharp change in the slope of the titration curve. In performing a titration, it is therefore necessary to add the titrant dropwise in that region. Note that at the equivalence point, the number of moles of NaOH added equals the number of moles of HCl initially present
Step by Step Solution
There are 3 Steps involved in it

Get step-by-step solutions from verified subject matter experts