

Question: Please answer the following questions correctly. 1. A multiverse analysis is designed to assess what type of uncertainty? O aleatory uncertainty O parameter uncertainty O
Please answer the following questions correctly.
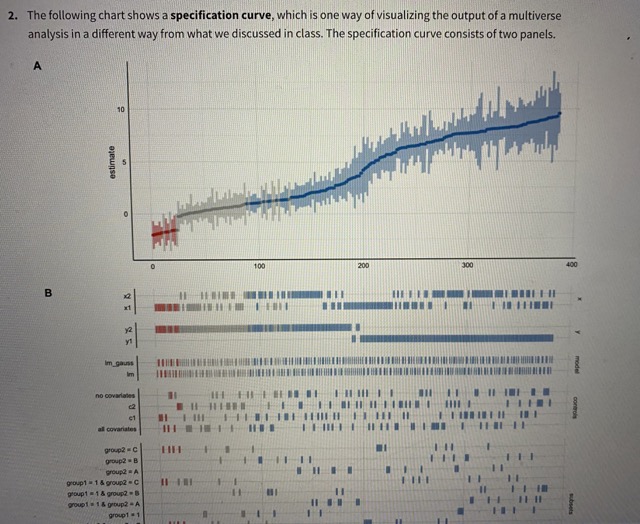
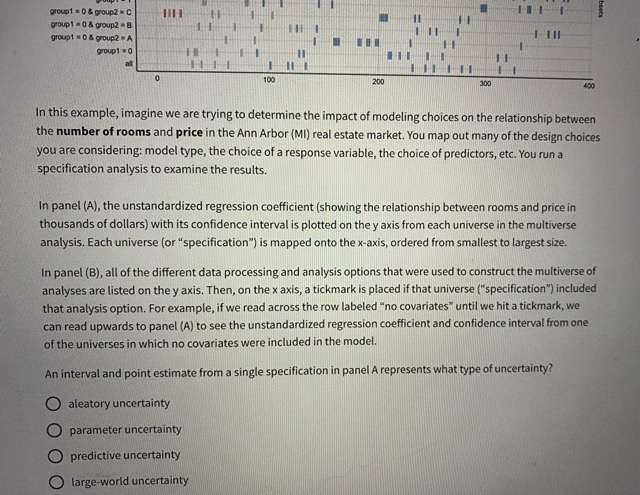
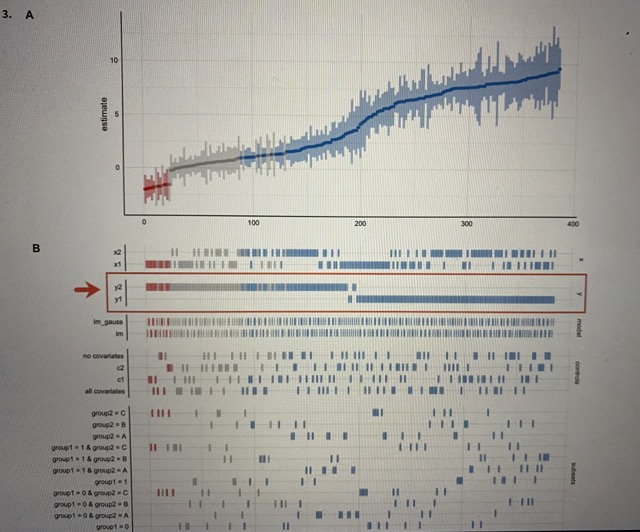
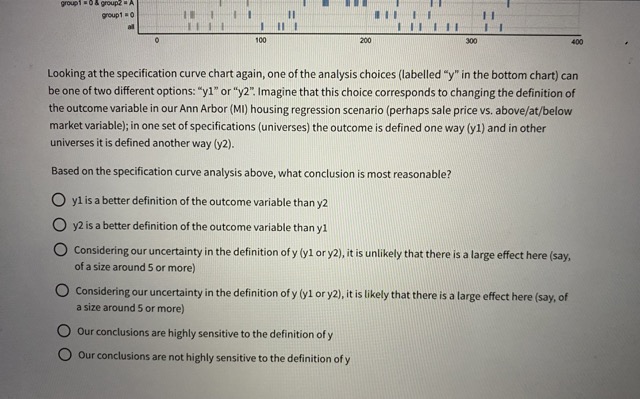
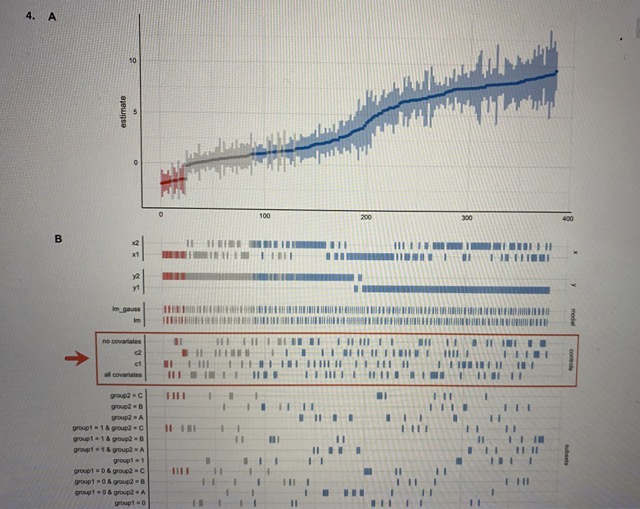
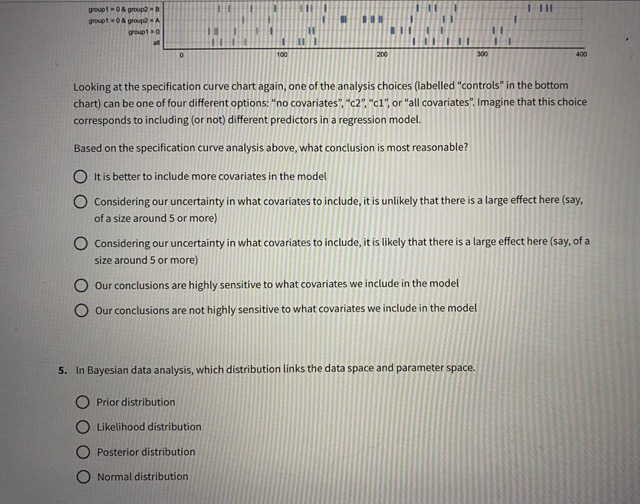
1. A multiverse analysis is designed to assess what type of uncertainty? O aleatory uncertainty O parameter uncertainty O predictive uncertainty large-world uncertainty O small-world uncertainty2. The following chart shows a specification curve, which is one way of visualizing the output of a multiverse analysis in a different way from what we discussed in class. The specification curve consists of two panels. A 10 estimate 200 B E A I IIIIIIIII HI group2 - B group2 A group1 = 1 4 group2 - C group1 = 1 4 group? = B Group 1 8 1group1 = 0 & group2 . C group1 = 0 & group2 - 8 group1 0 & group2 = A I IHI group1 = 0 100 200 100 In this example, imagine we are trying to determine the impact of modeling choices on the relationship between the number of rooms and price in the Ann Arbor (MI) real estate market. You map out many of the design choices you are considering: model type, the choice of a response variable, the choice of predictors, etc. You run a specification analysis to examine the results. In panel (A), the unstandardized regression coefficient (showing the relationship between rooms and price in thousands of dollars) with its confidence interval is plotted on the y axis from each universe in the multiverse analysis. Each universe (or "specification") is mapped onto the x-axis, ordered from smallest to largest size. In panel (B), all of the different data processing and analysis options that were used to construct the multiverse of analyses are listed on the y axis. Then, on the x axis, a tickmark is placed if that universe ("specification") included that analysis option. For example, if we read across the row labeled "no covariates" until we hit a tickmark, we can read upwards to panel (A) to see the unstandardized regression coefficient and confidence interval from one of the universes in which no covariates were included in the model. An interval and point estimate from a single specification in panel A represents what type of uncertainty? O aleatory uncertainty O parameter uncertainty O predictive uncertainty O large-world uncertainty3. A 10 estimate 5 100 200 3030 B POLL group . C group? = A II group 1 = 1 & group2 . C II II group 1 = 1 & group2 - A II group 1 m t IIII youp! = 0 & group? = B HI I I IHgroup . 0 4. group = A group 1 3 0 100 200 300 400 Looking at the specification curve chart again, one of the analysis choices (labelled "y" in the bottom chart) can be one of two different options: "yl" or "y2". Imagine that this choice corresponds to changing the definition of the outcome variable in our Ann Arbor (MI) housing regression scenario (perhaps sale price vs. above/at/below market variable); in one set of specifications (universes) the outcome is defined one way (y1) and in other universes it is defined another way (y2). Based on the specification curve analysis above, what conclusion is most reasonable? O yl is a better definition of the outcome variable than y2 y2 is a better definition of the outcome variable than y1 O) Considering our uncertainty in the definition of y (y1 or y2), it is unlikely that there is a large effect here (say, of a size around 5 or more) O Considering our uncertainty in the definition of y (yl or y2), it is likely that there is a large effect here (say, of a size around 5 or more) O Our conclusions are highly sensitive to the definition of y O Our conclusions are not highly sensitive to the definition of y4. A estimato 100 300 B I III group1 8 1 4 group? = B Top! = 1 6 group? = A I II IIII I IH III goup1 =0group 1 - 9 & group2 - D group1 0 400 Looking at the specification curve chart again, one of the analysis choices (labelled "controls" in the bottom chart] can be one of four different options: "no covariates", "c2", "cl", or "all covariates". Imagine that this choice corresponds to including (or not) different predictors in a regression model. Based on the specification curve analysis above, what conclusion is most reasonable? It is better to include more covariates in the model Considering our uncertainty in what covariates to include, it is unlikely that there is a large effect here (say, of a size around 5 or more) O Considering our uncertainty in what covariates to include, it is likely that there is a large effect here (say, of a size around 5 or more) O Our conclusions are highly sensitive to what covariates we include in the model O Our conclusions are not highly sensitive to what covariates we include in the model 5. In Bayesian data analysis, which distribution links the data space and parameter space. Prior distribution Likelihood distribution O Posterior distribution O Normal distribution6. According to course lectures, one advantage of a credible interval over a confidence interval is: O The credible interval is generally more accurate than the confidence interval. O The credible interval is generally larger than the confidence interval. O The credible interval can be calculated with fewer degrees of freedom (DOF) than the confidence interval. The credible has a more intuitive interpretation than the confidence interval. 7. In Bayesian data analysis, which of the following can inform the prior distribution? [Select all that apply] Data collected from previous studies Data collected for the current study Data used to validate the model Expert opinion/professional judgment 8. In Bayesian data analysis, the likelihood function represents: The probability of observing the data given the parameters O The probability of observing the parameters given the data The posterior distribution of the parameters O The credible intervals for Bayesian predictions9. Which of the following is an example of a non-informative prior distribution? Uniform distribution O Normal distribution O Exponential distribution O A beta distribution with (alpha = 5, beta = 5) O A binomial distribution O A Bernoulli distribution 10. As discussed in the lectures, which of the following is a benefit of using Bayesian data analysis? It provides exact and deterministic results for all statistical models. It allows for straightforward interpretation of p-values. It incorporates prior information and updates beliefs based on observed data. O It requires fewer assumptions compared to classical frequentist analysis. 11. Which of the following is a limitation of Bayesian data analysis? O It is computationally intensive and can be slow for large datasets. It requires the assumption of a specific parametric distribution for the data. O It cannot handle complex models with multiple predictors. O It relies heavily on p-values for hypothesis testing
Step by Step Solution
There are 3 Steps involved in it

Get step-by-step solutions from verified subject matter experts