

Question: please answer The following table represents a grouped frequency distribution of the number of hours spent on the computer per week for 54 students. What
please answer 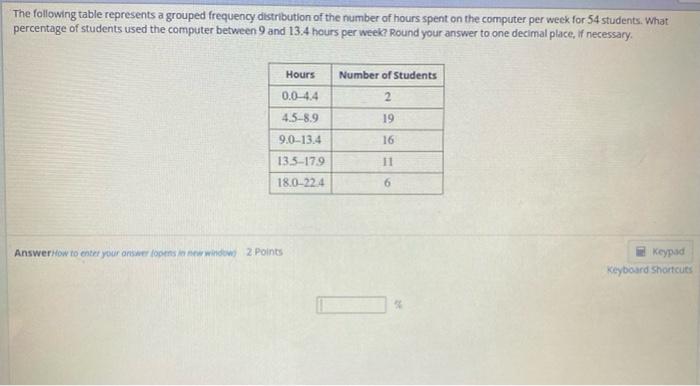
The following table represents a grouped frequency distribution of the number of hours spent on the computer per week for 54 students. What percentage of students used the computer between 9 and 13.4 hours per week? Round your answer to one decimal place, If necessary Hours 0.0-4.4 Number of Students 2 19 4.5-8.9 9.0-13.4 16 135.179 11 18.0-224 6 Answer How to enter your answer for window 2 Points Keypad Keyboard Shortcuts
Step by Step Solution
There are 3 Steps involved in it
1 Expert Approved Answer
Step: 1 Unlock

Question Has Been Solved by an Expert!
Get step-by-step solutions from verified subject matter experts
Step: 2 Unlock
Step: 3 Unlock