

Question: Please answer the following using the graph The accompanying graph shows the total amount of a. Estimate the average gasoline consumption gasoline A in the
Please answer the following using the graph

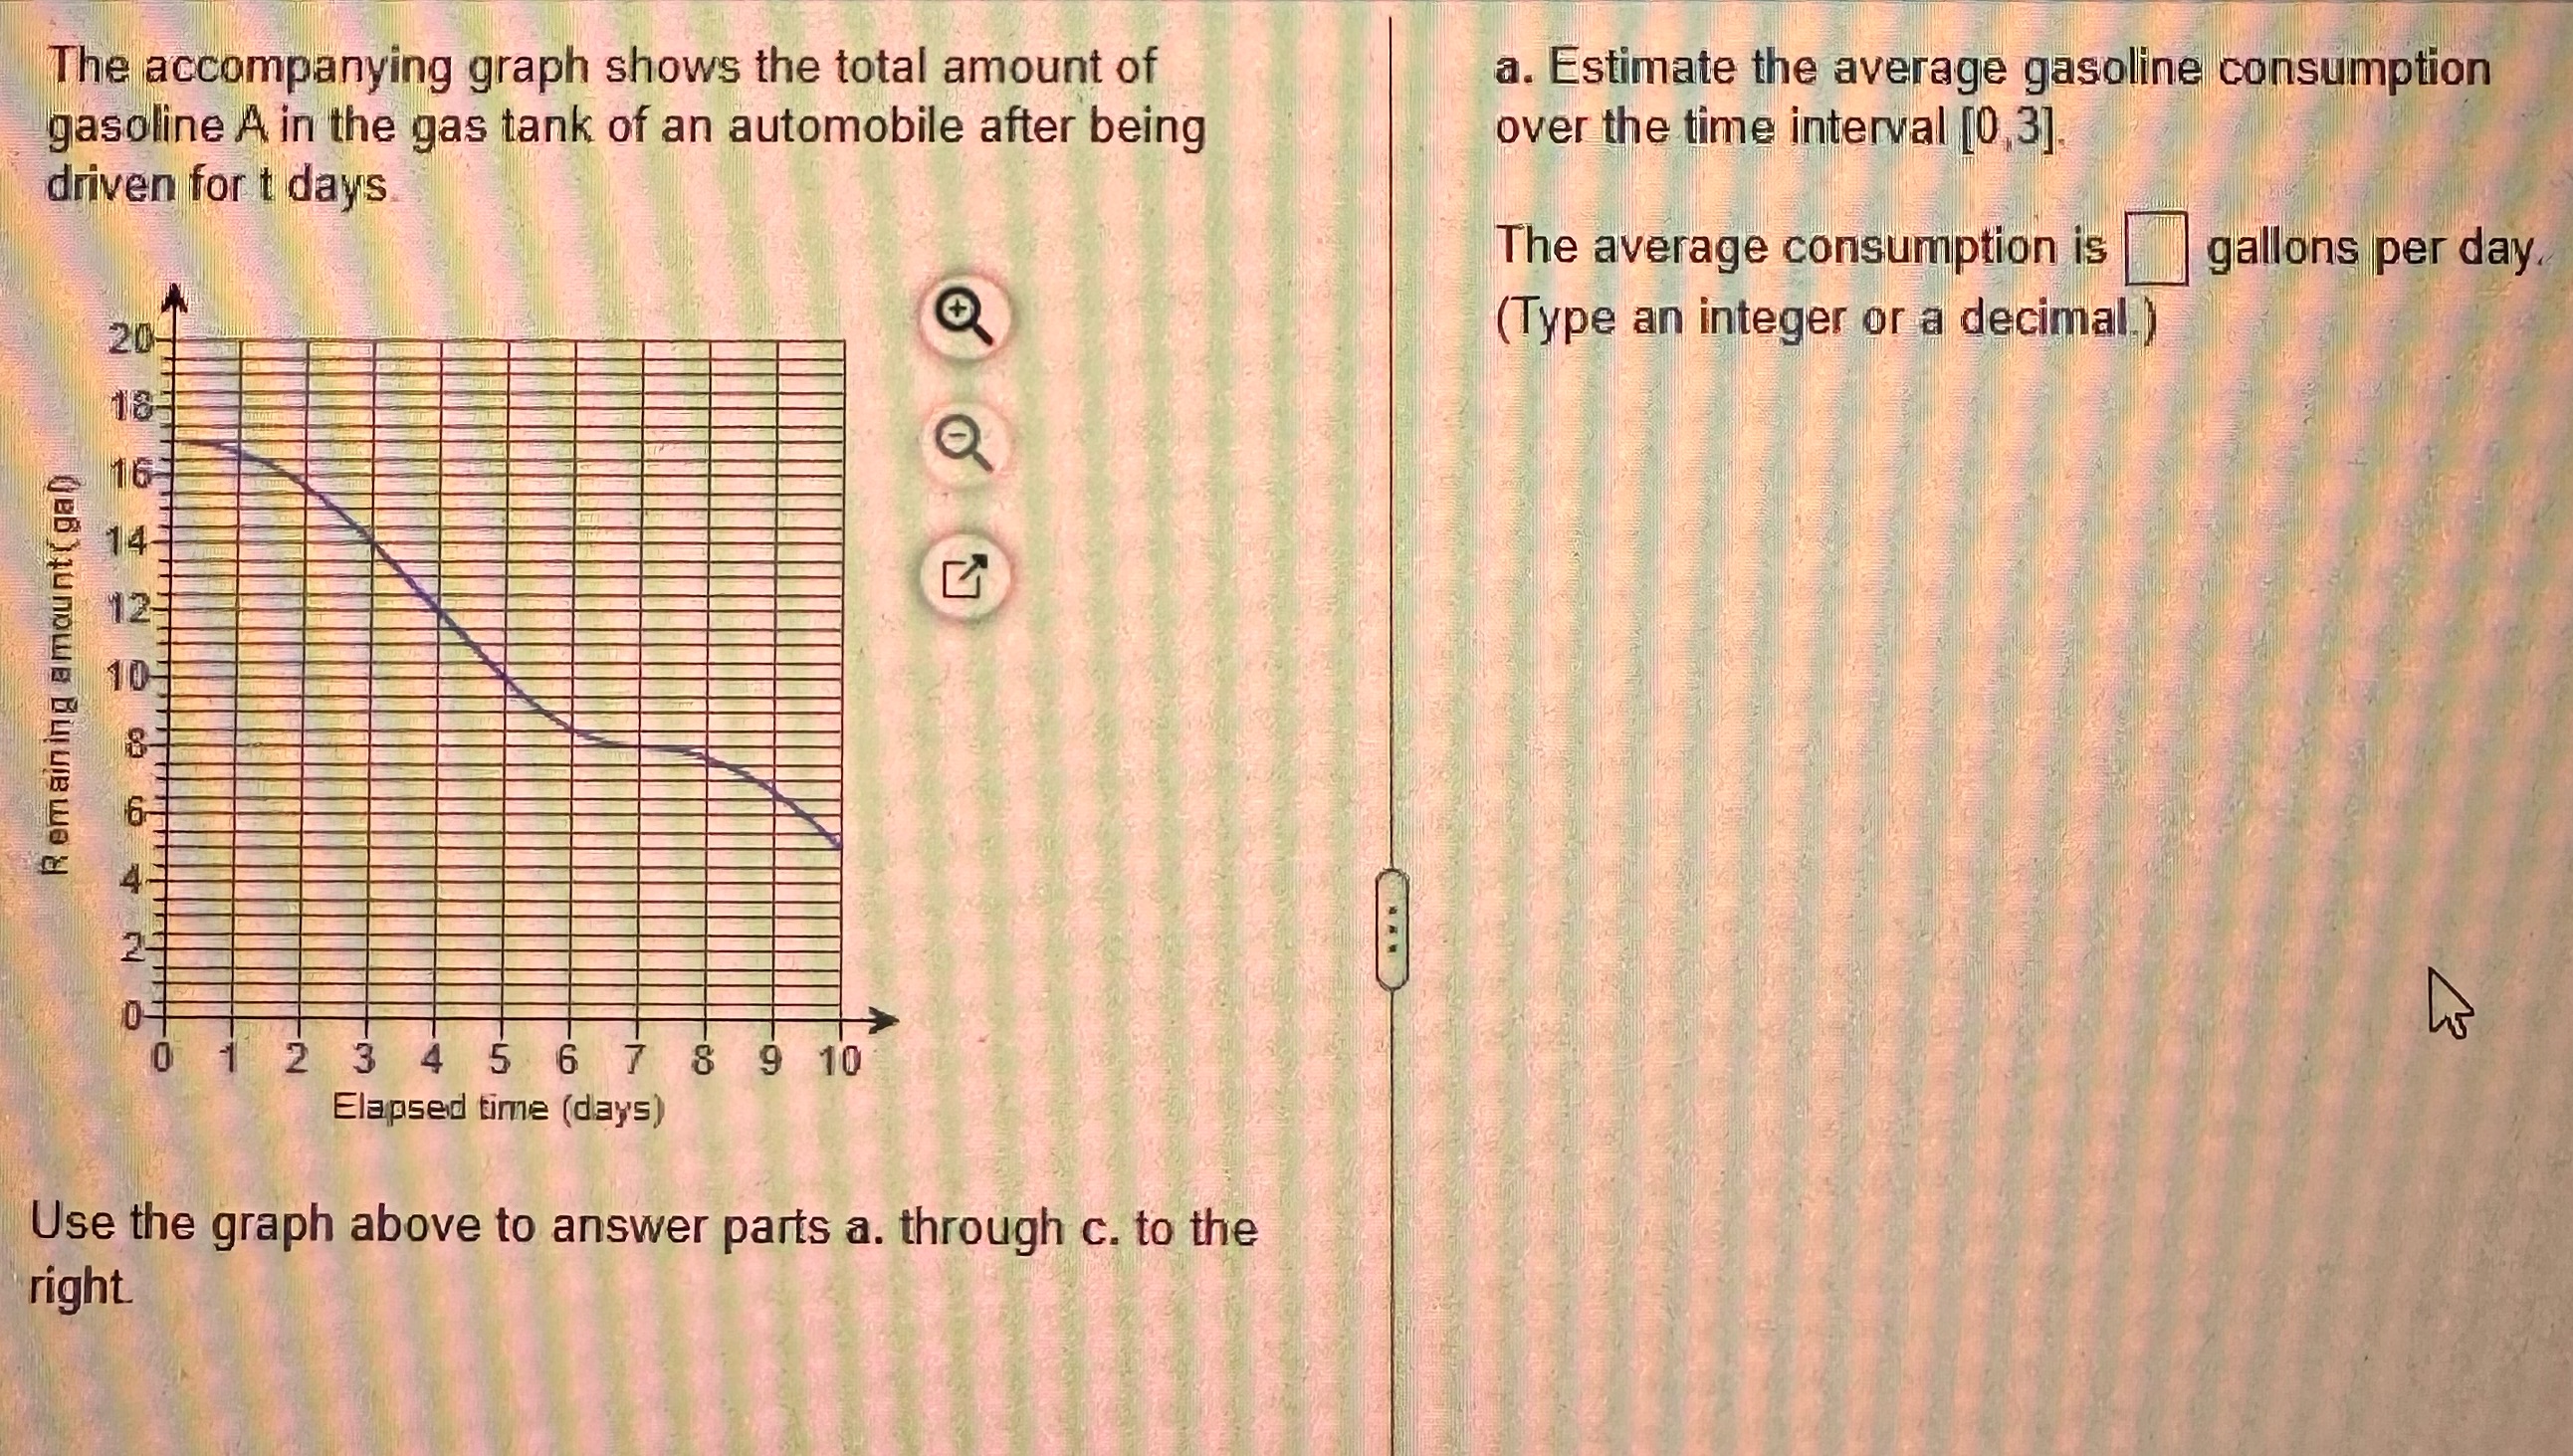
The accompanying graph shows the total amount of a. Estimate the average gasoline consumption gasoline A in the gas tank of an automobile after being over the time interval [0,3]. driven for t days The average consumption is gallons per day. 207 (Type an integer or a decimal.) Remaining amount ( gad 5 6 8 9 10 Elapsed time (days) Use the graph above to answer parts a. through c. to the right
Step by Step Solution
There are 3 Steps involved in it
1 Expert Approved Answer
Step: 1 Unlock

Question Has Been Solved by an Expert!
Get step-by-step solutions from verified subject matter experts
Step: 2 Unlock
Step: 3 Unlock