

Question: please answer The graph below shows a demand curve before and after a tax. Because the tax raises the price of the good, it leads
please answer
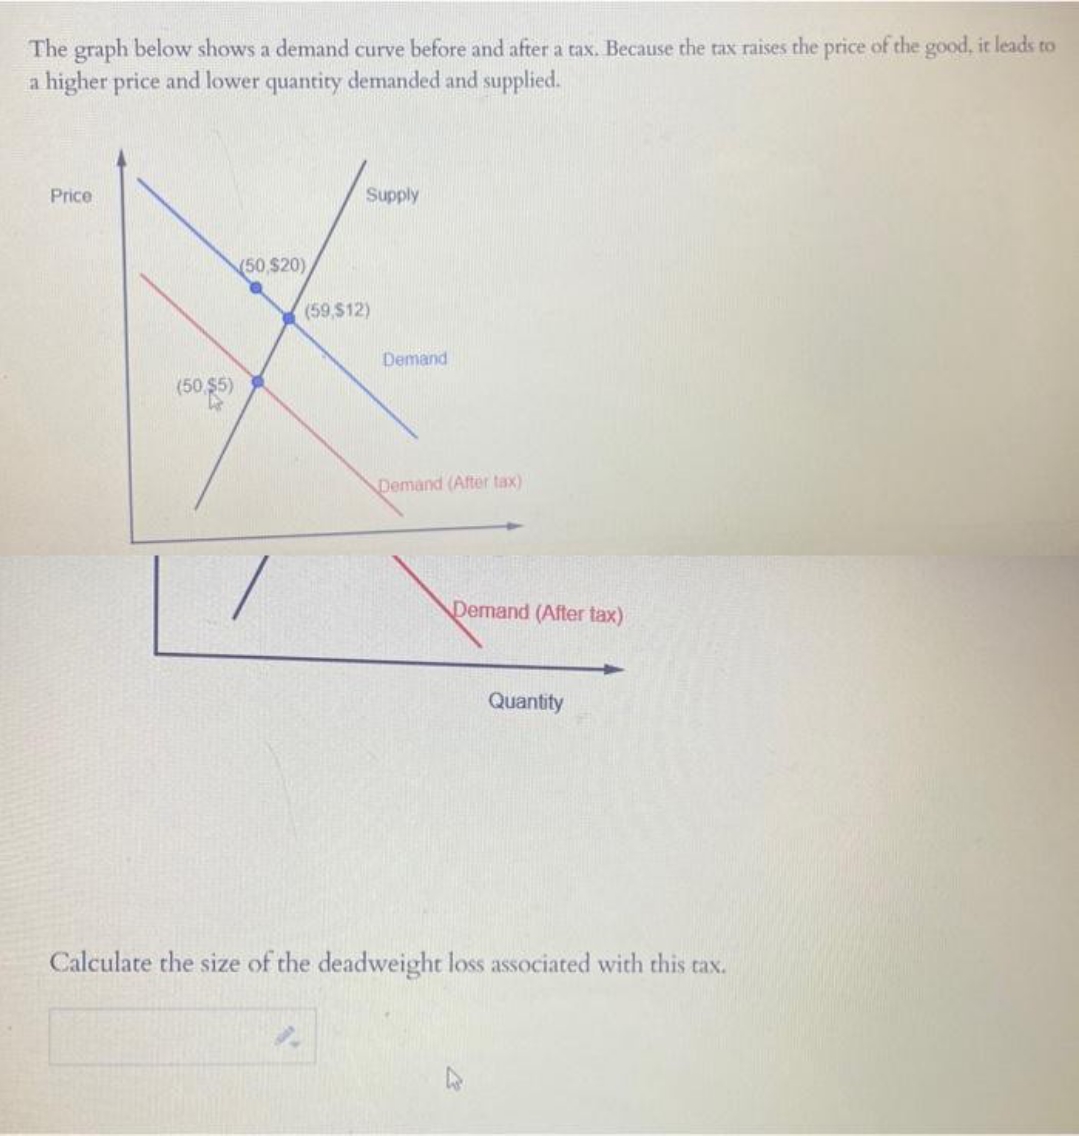
The graph below shows a demand curve before and after a tax. Because the tax raises the price of the good, it leads to a higher price and lower quantity demanded and supplied. Price Supply (50,$20) (59,$12) Demand (50,$5) Demand (After tax) Demand (After tax) Quantity Calculate the size of the deadweight loss associated with this tax
Step by Step Solution
There are 3 Steps involved in it
1 Expert Approved Answer
Step: 1 Unlock

Question Has Been Solved by an Expert!
Get step-by-step solutions from verified subject matter experts
Step: 2 Unlock
Step: 3 Unlock