

Question: Please answer the problem uniquely. DO NOT copy any answers online. Otherwise, it'll result in automatic thumbs down. Thanks Twenty households in a city were
Please answer the problem uniquely. DO NOT copy any answers online. Otherwise, it'll result in automatic thumbs down.
Thanks
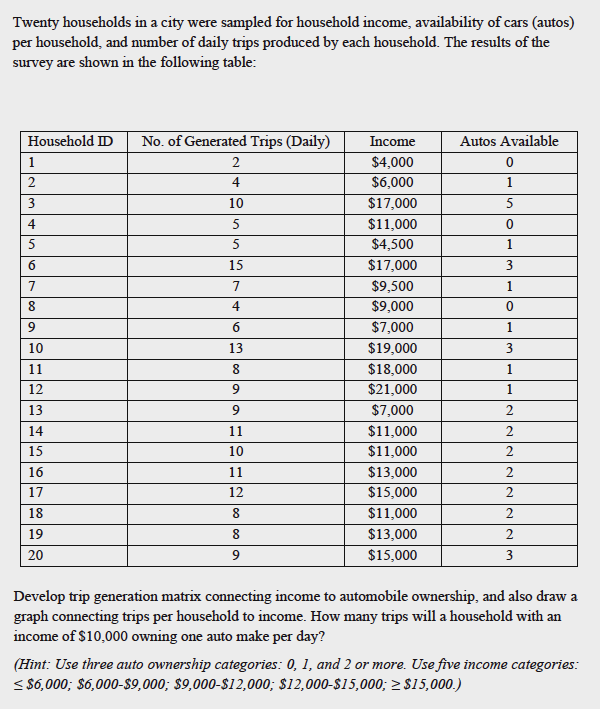
Twenty households in a city were sampled for household income, availability of cars (autos) per household, and number of daily trips produced by each household. The results of the survey are shown in the following table: Household ID No. of Generated Trips (Daily) Income Autos Available 1 2 $4,000 0 2 4 $6,000 3 10 $17,000 4 5 $11,000 0 5 5 $4,500 15 $17,000 3 7 $9,500 8 $9,000 9 $7,000 10 13 $19,000 11 $18,000 12 $21,000 13 9 $7,000 14 11 $11,000 15 10 $11,000 NNNNN 16 11 $13,000 17 12 $15,000 18 8 $11,000 2 19 8 $13,000 20 9 $15,000 Develop trip generation matrix connecting income to automobile ownership, and also draw a graph connecting trips per household to income. How many trips will a household with an income of $10,000 owning one auto make per day? (Hint: Use three auto ownership categories: 0, 1, and 2 or more. Use five income categories: $6,000; $6,000-$9,000; $9,000-$12,000; $12,000-$15,000; 2 $15,000.)
Step by Step Solution
There are 3 Steps involved in it

Get step-by-step solutions from verified subject matter experts