

Question: Please answer the question based on pic i have attached. Run ACF and time series plot to determine the integration of your series (SA data).
Please answer the question based on pic i have attached.
Run ACF and time series plot to determine the integration of your series (SA data). That is, is your data stationary? If not, take differences to get your data stationary.
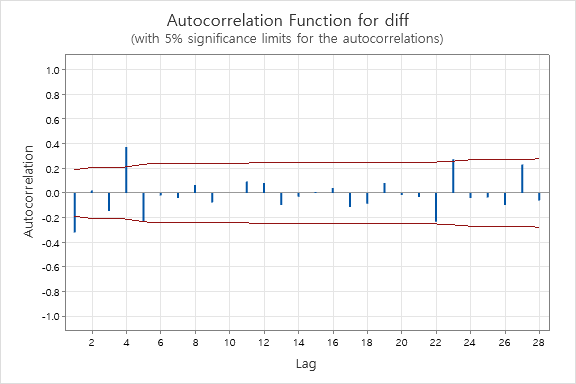
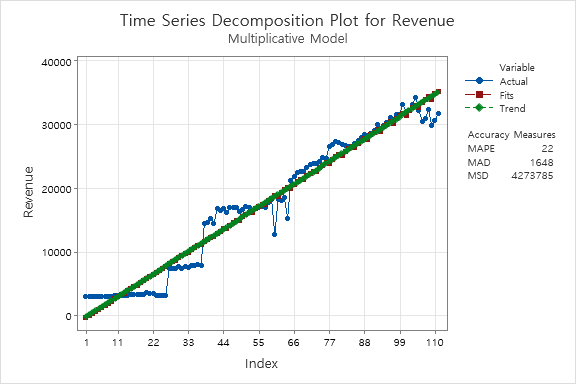
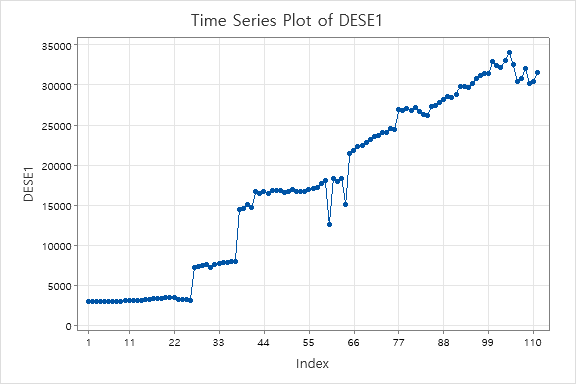
Autocorrelation Function for diff (with 5% significance limits for the autocorrelations) 1.0 0.8 0.6 0.4 0.2 Autocorrelation 0.0 -0.2 -0.4 -0.6 -0.8 -1.0 2 6 8 10 12 14 16 18 20 22 24 26 28 LagTime Series Decomposition Plot for Revenue Multiplicative Model 40000 Variable Actual Fits Trend 30000 Accuracy Measures MAPE 22 MAD 1648 MSD 4273785 Revenue 20000 10000 1 11 22 33 44 55 66 77 88 99 110 IndexTime Series Plot of DESE1 35000 30000 25000 20000 DESE1 15000 10000 5000 11 22 33 44 55 66 77 88 99 110 Index
Step by Step Solution
There are 3 Steps involved in it

Get step-by-step solutions from verified subject matter experts