

Question: Could you please explain and comment on the data characteristics in detail based on the results I got from time series plot and ACF plots.

Could you please explain and comment on the data characteristics in detail based on the results I got from time series plot and ACF plots.
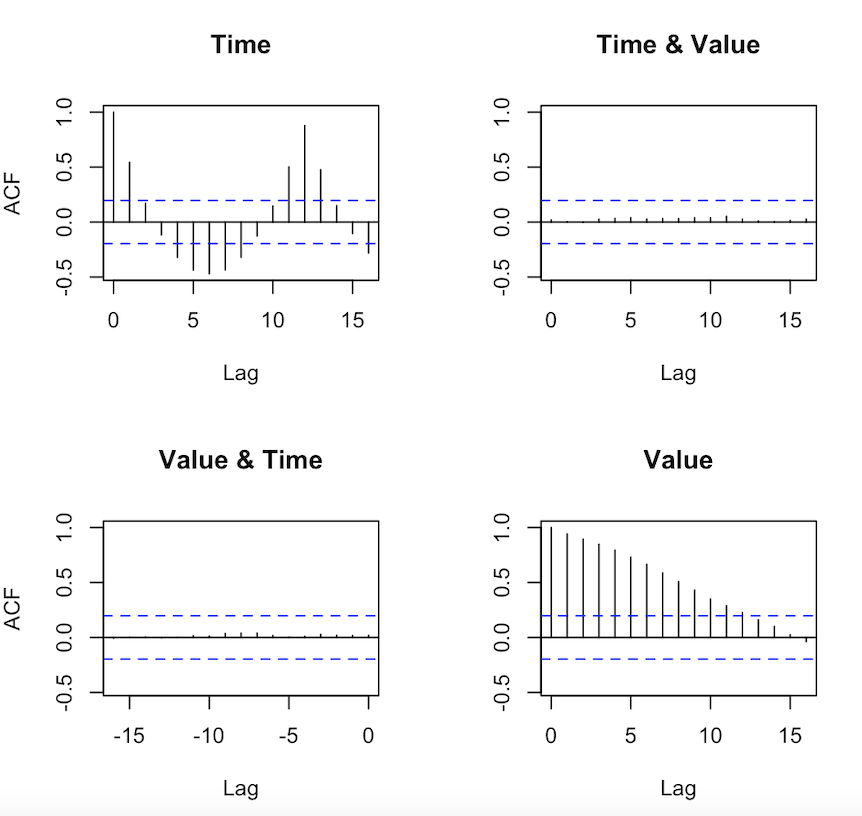
I have attached 3 pictures, could you please explain these datas (ACF and Time series plot) characteristics in detail? (stationary or non-stationary). Thank you very much for your time in advance!
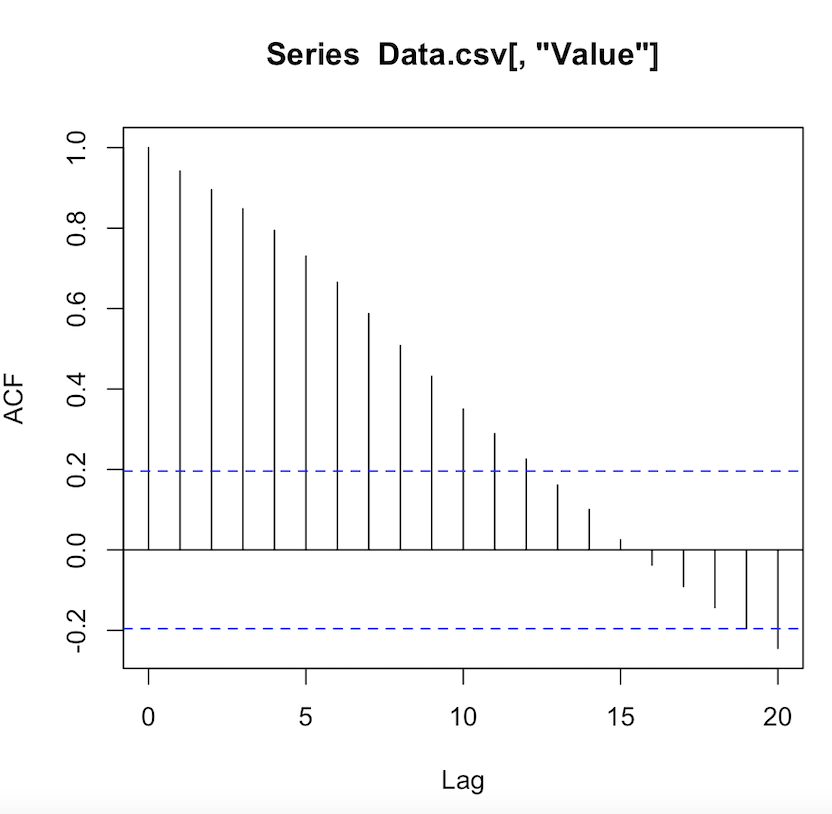
![Thank you very much for your time in advance! Series Data.csv[, "Value"]](https://s3.amazonaws.com/si.experts.images/answers/2024/06/6678739c1a534_9476678739befc09.jpg)
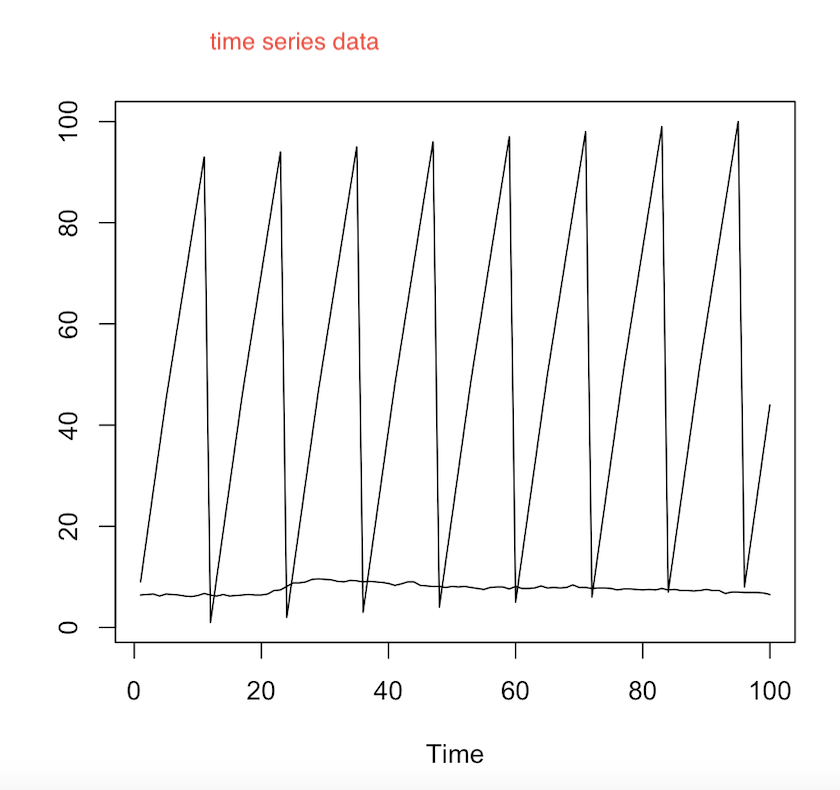

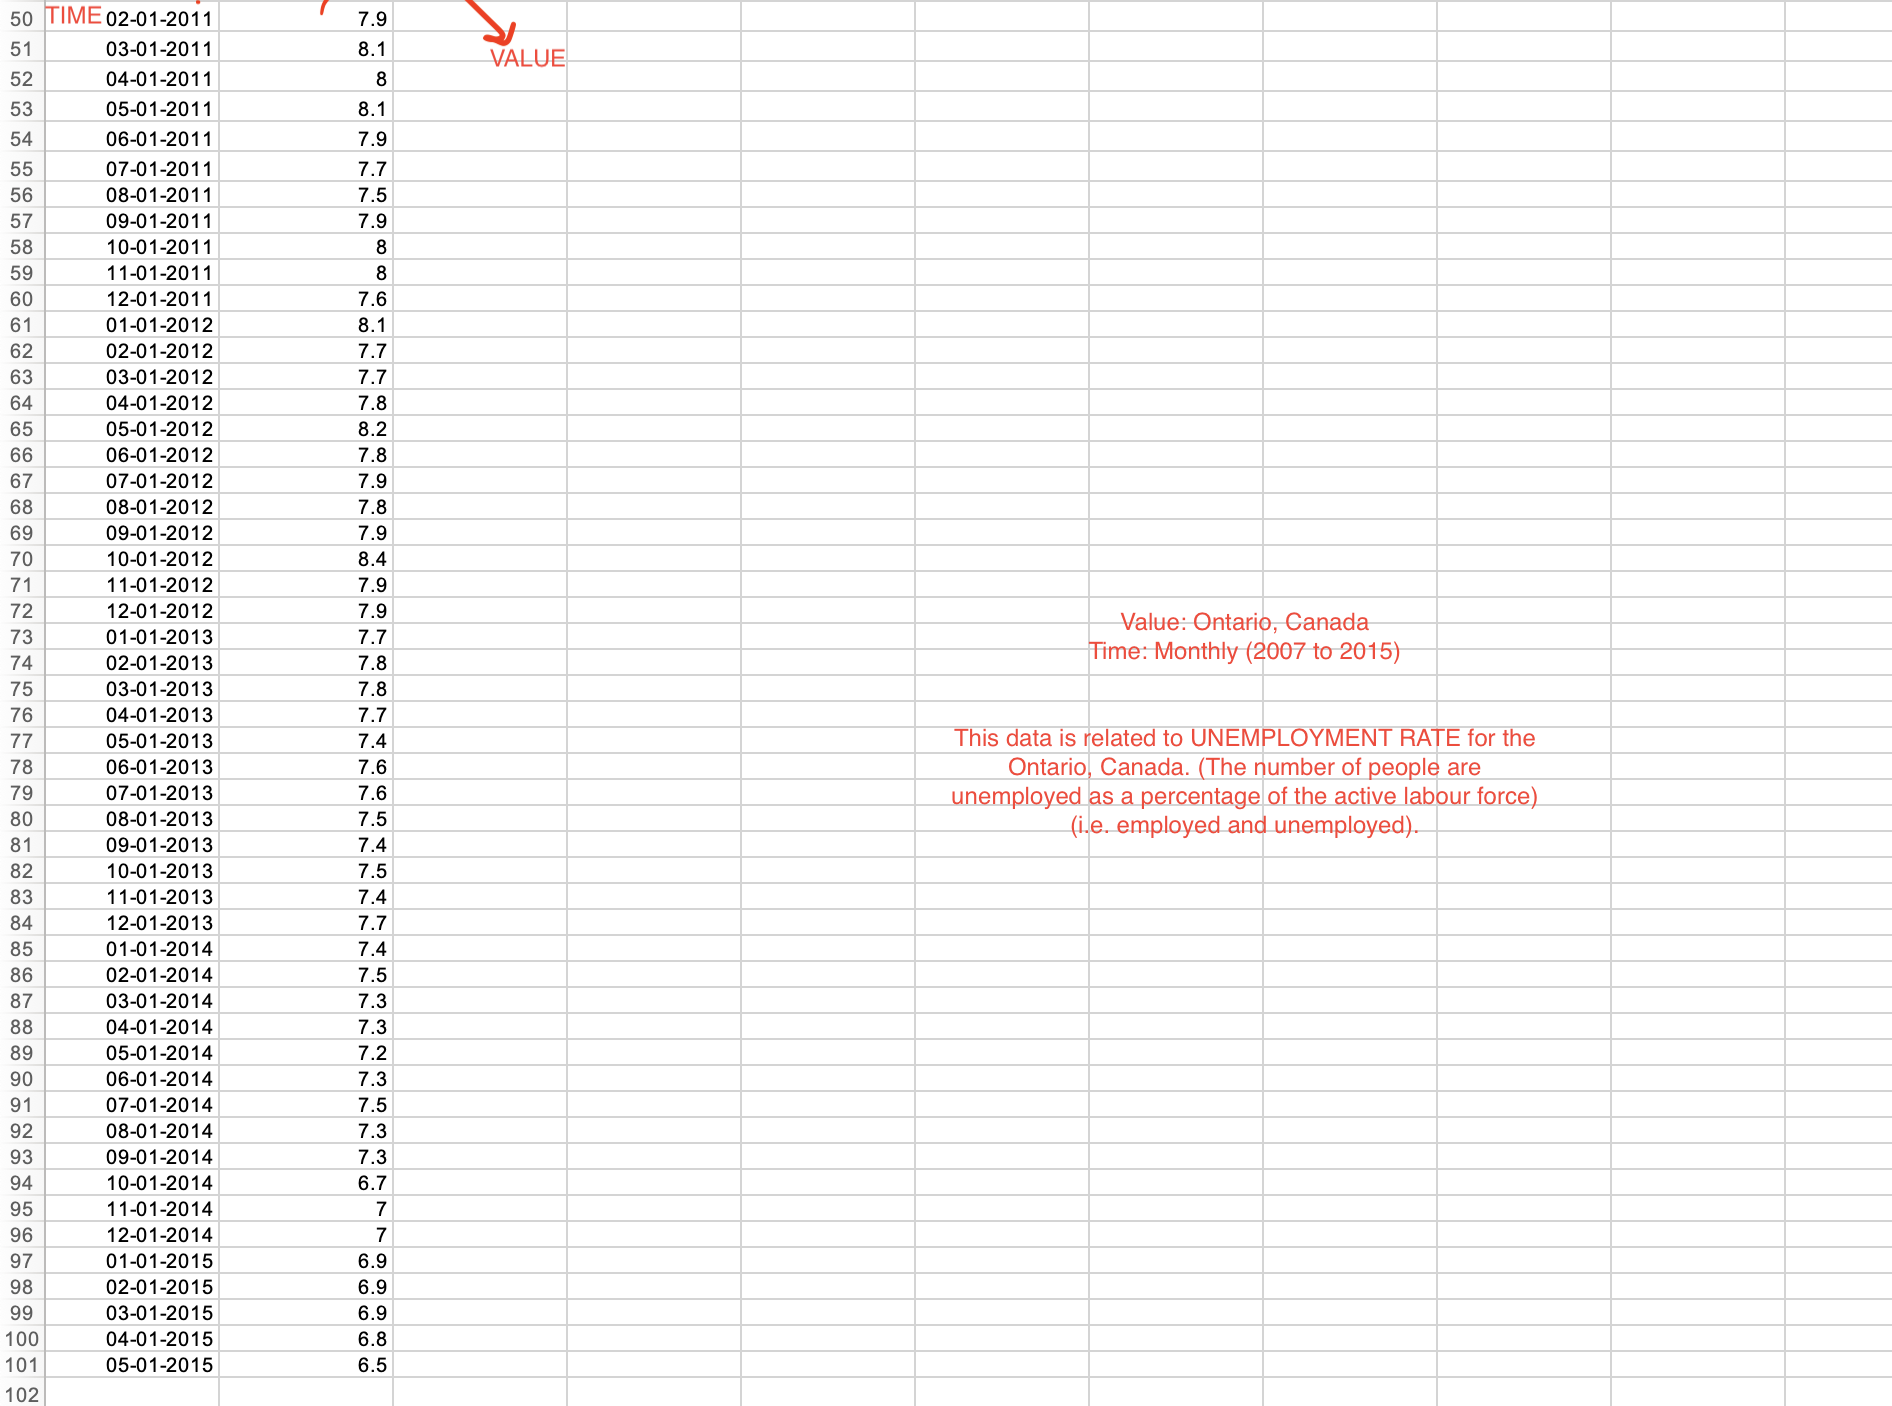
Series Data.csv[, "Value"] 1.0 0.8 ACF -0.2 0.0 0.2 0.4 0.6 0 10 15 20 LagTime Time & Value ACF -0.5 0.0 0.5 1.0 -0.5 0.0 0.5 1.0 0 5 10 15 0 5 10 15 Lag Lag Value & Time Value ACF -0.5 0.0 0.5 1.0 -0.5 0.0 0.5 1.0 -15 -10 -5 O 0 5 10 15 Lag Lagtime series data 100 O 0 20 40 60 80 100 Time50 TIME 02-01-2011 7.9 51 03-01-2011 8.1 VALUE 52 04-01-2011 8 53 05-01-2011 8.1 54 06-01-2011 7.9 55 07-01-2011 7.7 56 08-01-2011 7.5 57 09-01-2011 79 58 10-01-2011 8 59 11-01-2011 8 60 12-01-2011 7.6 61 01-01-2012 8.1 62 02-01-2012 7.7 63 03-01-2012 7.7 64 04-01-2012 7.8 65 05-01-2012 8.2 66 06-01-2012 7.8 67 07-01-2012 7.9 68 08-01-2012 7.8 69 09-01-201 7.9 70 10-01-2012 8.4 71 11-01-2012 7.9 72 12-01-2012 7.9 Value: Ontario, Canada 73 01-01-2013 7.7 74 02-01-2013 Time: Monthly (2007 to 2015) 7.8 75 03-01-2013 7.8 76 04-01-2013 7.7 05-01-2013 7.4 This data is related to UNEMPLOYMENT RATE for the 78 06-01-2013 7.6 Ontario, Canada. (The number of people are 79 07-01-2013 7.6 unemployed as a percentage of the active labour force) 80 08-01-2013 7.5 (i.e. employed and unemployed). 81 09-01-2013 7.4 82 10-01-2013 7.5 83 11-01-2013 7.4 84 12-01-2013 7.7 85 01-01-2014 7.4 86 02-01-2014 7.5 87 03-01-2014 7.3 88 04-01-2014 7.3 89 05-01-2014 7.2 90 06-01-2014 7.3 91 07-01-2014 7.5 92 08-01-2014 7.3 93 09-01-2014 7.3 94 10-01-2014 6.7 95 11-01-2014 7 96 12-01-2014 97 01-01-2015 6.9 98 02-01-2015 6.9 99 03-01-2015 6.9 100 04-01-2015 6.8 01 05-01-2015 6 5 102
Step by Step Solution
There are 3 Steps involved in it

Get step-by-step solutions from verified subject matter experts