

Question: please answer the questions 4.1 Define phase This study is performed at one of the plants in Y Company. This plant is named wafer biscuit
please answer the questions
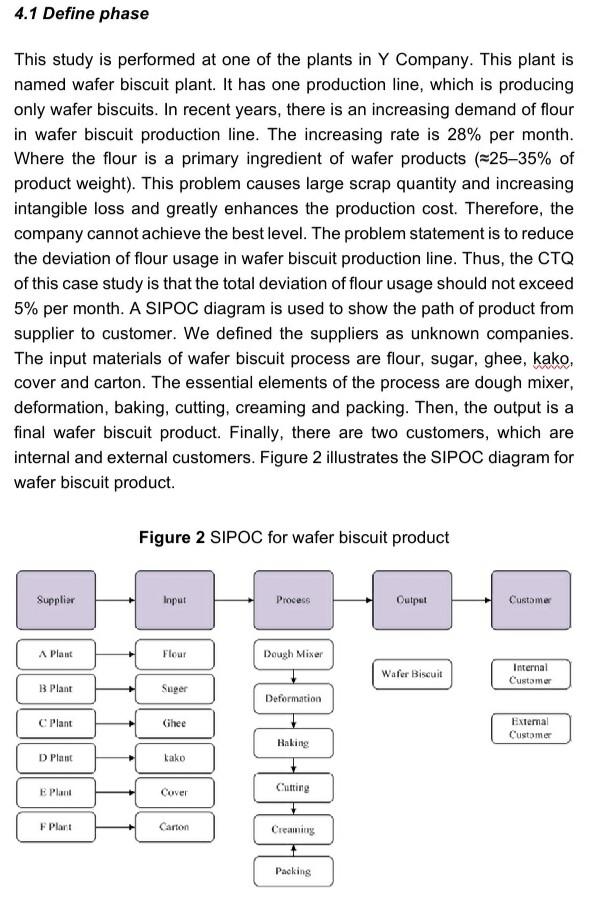
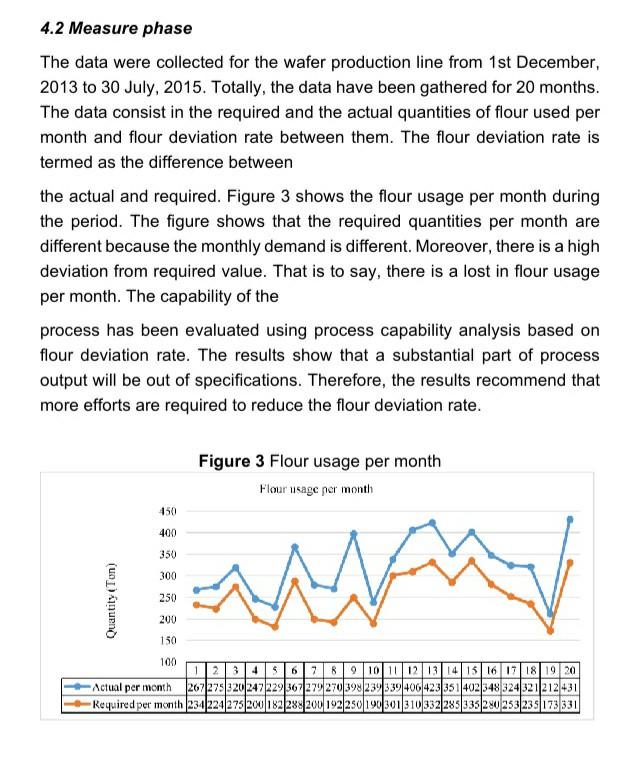
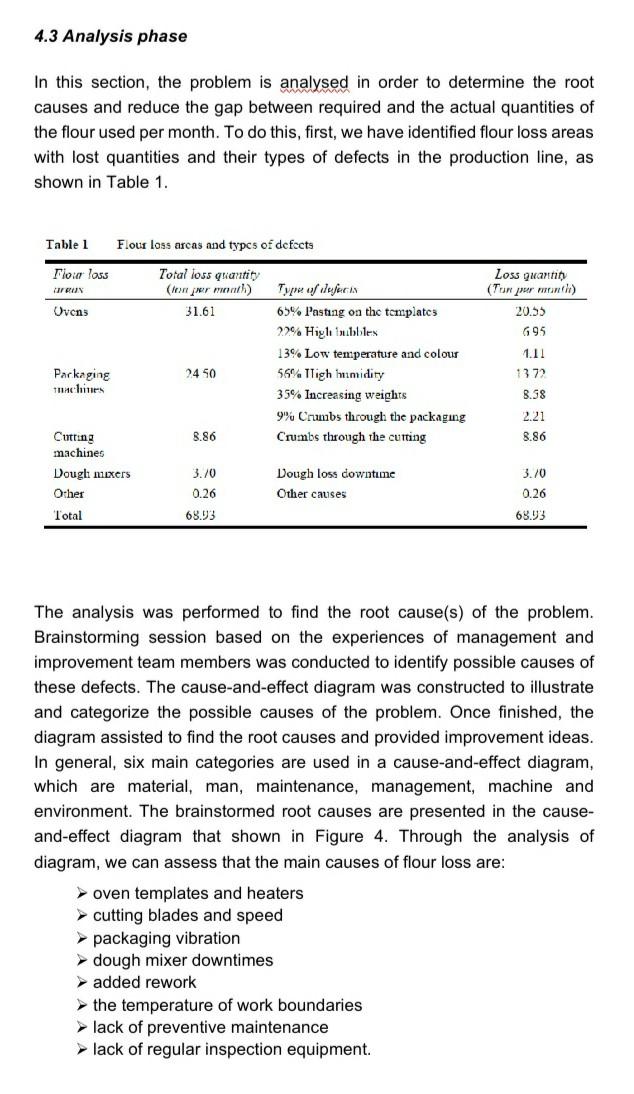
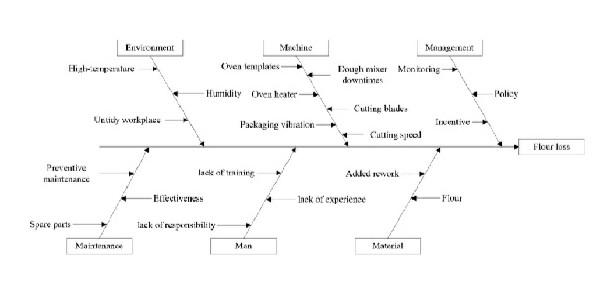
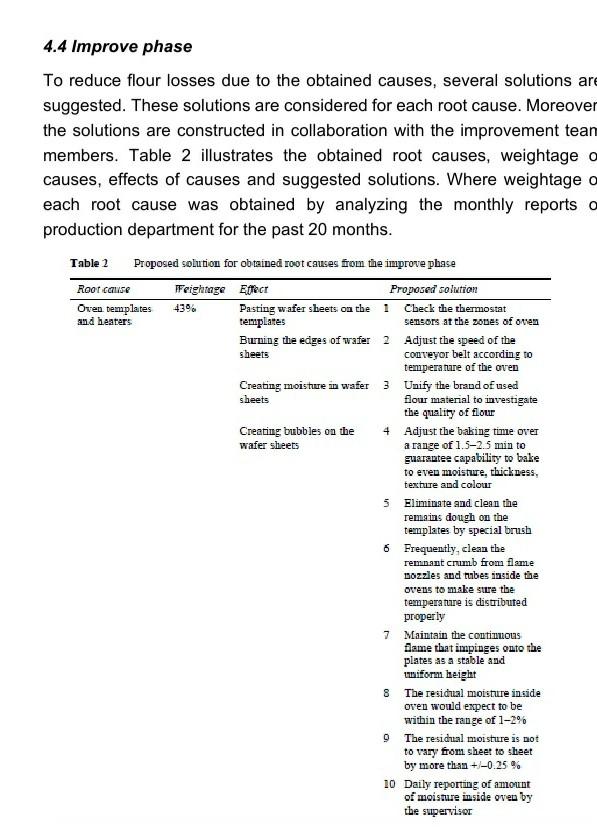
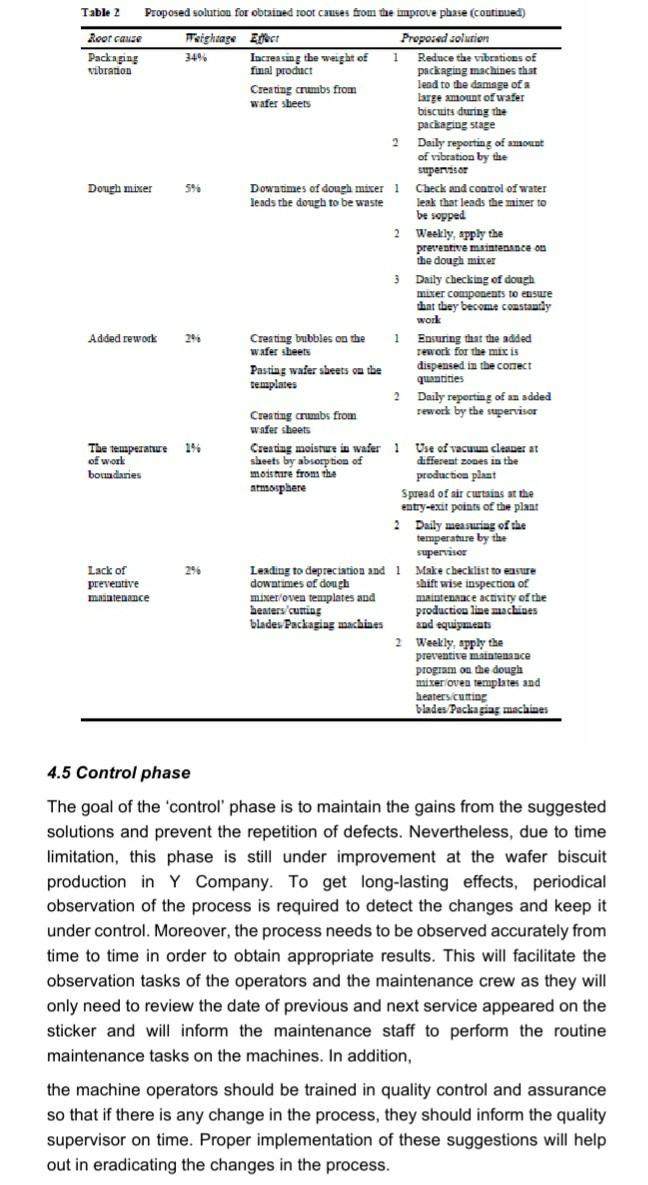
4.1 Define phase This study is performed at one of the plants in Y Company. This plant is named wafer biscuit plant. It has one production line, which is producing only wafer biscuits. In recent years, there is an increasing demand of flour in wafer biscuit production line. The increasing rate is 28% per month. Where the flour is a primary ingredient of wafer products (=2535% of product weight). This problem causes large scrap quantity and increasing intangible loss and greatly enhances the production cost. Therefore, the company cannot achieve the best level. The problem statement is to reduce the deviation of flour usage in wafer biscuit production line. Thus, the CTQ of this case study is that the total deviation of flour usage should not exceed 5% per month. A SIPOC diagram is used to show the path of product from supplier to customer. We defined the suppliers as unknown companies. The input materials of wafer biscuit process are flour, sugar, ghee, kako, cover and carton. The essential elements of the process are dough mixer, deformation, baking, cutting, creaming and packing. Then, the output is a final wafer biscuit product. Finally, there are two customers, which are internal and external customers. Figure 2 illustrates the SIPOC diagram for wafer biscuit product. Figure 2 SIPOC for wafer biscuit product Suppliar Input Process Output Customer Plant Fleur Dough Mixer Wafer Biscuit Internal Customer B Plant Suger Deformation C Plant Ghee 1-1-0-0-01 External Customer Haking D Plant kako E Plant Cover Cutting F Plant Carton Creaming Packing 4.2 Measure phase The data were collected for the wafer production line from 1st December, 2013 to 30 July, 2015. Totally, the data have been gathered for 20 months. The data consist in the required and the actual quantities of flour used per month and flour deviation rate between them. The flour deviation rate is termed as the difference between the actual and required. Figure 3 shows the flour usage per month during the period. The figure shows that the required quantities per month are different because the monthly demand is different. Moreover, there is a high deviation from required value. That is to say, there is a lost in flour usage per month. The capability of the process has been evaluated using process capability analysis based on flour deviation rate. The results show that a substantial part of process output will be out of specifications. Therefore, the results recommend that more efforts are required to reduce the flour deviation rate. Figure 3 Flour usage per month Flour usage per month 450 400 350 300 Quantity (Ton) 250 200 150 100 1 2 3 4 5 6 7 8 9 10 11 12 13 14 15 16 17 18 19 20 -Actual per month 207275 320 247 229 307279 270398 239339400423 351 402348 324 321212 431 Required per month 234 224 275 200 182288200192250190301310332 285 335 280 253 235 173 331 4.3 Analysis phase In this section, the problem is analysed in order to determine the root causes and reduce the gap between required and the actual quantities of the flour used per month. To do this, first, we have identified flour loss areas with lost quantities and their types of defects in the production line, as shown in Table 1. Loss quantity (Ton per months) 20.55 695 1.11 13 72 Table 1 Flour loss arcas and types of defects Tlour loss Total loss quantity AT RUN (w per moll) Type of legerin Ovens 31.61 65% Pasting on the templates 22% Hiyle bubbles 13% Low temperature and colour Packaging 24 50 56% Iligh Immidity Tuachines 35% Increasing weights 9% Crumbs through the packaging Cutting 8.86 Crumbs through the cutting machines Dougli mixers 3.70 Dough loss downtune Other 0.26 Other causes Total 68.03 8.58 2.21 8.86 3./0 0.26 68.03 The analysis was performed to find the root cause(s) of the problem. Brainstorming session based on the experiences of management and improvement team members was conducted to identify possible causes of these defects. The cause-and-effect diagram was constructed to illustrate and categorize the possible causes of the problem. Once finished, the diagram assisted to find the root causes and provided improvement ideas. In general, six main categories are used in a cause-and-effect diagram, which are material, man, maintenance, management, machine and environment. The brainstormed root causes are presented in the cause- and-effect diagram that shown in Figure 4. Through the analysis of diagram, we can assess that the main causes of flour loss are: oven templates and heaters > cutting blades and speed packaging vibration dough mixer downtimes > added rework the temperature of work boundaries > lack of preventive maintenance lack of regular inspection equipment. E VICE Mixin Muyen Hire en lemplates Tough mixel Montering downtines Humility Ches heater Polscy Culing black Vekty utkplacu Packaging vibration Inne Tuting-al Flour loss Presentive maintenance koninis Akku wak Effectivenes Inck of experience FIOLI Spare parts task of're pasibility Mate Man Material 4.4 Improve phase To reduce flour losses due to the obtained causes, several solutions are suggested. These solutions are considered for each root cause. Moreover the solutions are constructed in collaboration with the improvement tean members. Table 2 illustrates the obtained root causes, weightage causes, effects of causes and suggested solutions. Where weightage o each root cause was obtained by analyzing the monthly reports o production department for the past 20 months. Table 2 Proposed solution for obtained root causes from the improve phase Root cause Feightage Effect Proposed solution Oven templates 4396 Pasting wafer sheets on the i Check the thermostat and heaters templates sensors at the zobes of oven Burning the edges of wafer 2 Adjust the speed of the sheets conveyor belt according to temperature of the oven Creating moisture in wafer 3 Unify the brand of used sheets flour material to investigate the quality of flour Creating bubbles on the 4 Adjust the baking time over Wafer sheets a range of 1.5-2.5 min to guarantee capability to bake to even moisture, thickness, texture and colour 5 Eliminate and clean the remains dough on the templates by special brush 6 Frequently, clean the remnant crumb from flame nozzles and tabes inside the ovens to make sure the temperature is distributed properly 7 Maintain the continuous flame that impinges onto the plates as a stable and wiform height 8 The residual moisture inside oven would expect to be within the range of 1-2% 9 The residual moisture is not to vary from sheet to sheet by more than +/-0.25% 10 Daily reporting of amount of moisture inside oven by the supervisor Table 2 Proposed solution for obtained root causes from the improve phase (continued) Roer cause Teightage Effect Proposed solution Packaging 34% Increasing the weight of 1 Reduce the vibrations of vibration final product packaging machines that Creating crumbs from lead to the damage of a wafer sheets large amount of water biscuits during the packaging stage 2 Daily reporting of smount of vibration by the supervisor Dough mixer 5% Downtimes of dough mixer 1 Check and control of water leads the dough to be waste leak that leads the mixer to be sopped 2 Weekly, apply the preventive maintenance on the dough mixer 3 Daily checking of dough mixer components to ensure that they become constantly work Added rework 296 1% The temperature of work boundaries Spread of Creating bubbles on the 1 Ensuring that the added wafer sheets rework for the mir is Pasting wafer sheets on the dispensed in the connect templates quantities Daily reporting of an added Creating crumbs from rework by the supervisor wafer sheets Creating moisture in water 1 Use of vacuum cleaner at sheets by absorption of different zones be moisture from the production plan: mosphere of sir curtains at the entry-exit points of the plant 2 Daily measuring of the temperature by the supervisor Leading to depreciation and 1 Make checklist to easure downtimes of dough shift wise inspection of mixeroven templates and maintenance activity of the heaters/cutting productiou line machines blades Packaging machines and equipaments 2 Weekly, apply the preventive maintenance program on the dough mixer oven templates and heaters cutting blades Packagias machines 296 Lack of preventive matenance 4.5 Control phase The goal of the control' phase is to maintain the gains from the suggested solutions and prevent the repetition of defects. Nevertheless, due to time limitation, this phase is still under improvement at the wafer biscuit production in Y Company. To get long-lasting effects, periodical observation of the process is required to detect the changes and keep it under control. Moreover, the process needs to be observed accurately from time to time in order to obtain appropriate results. This will facilitate the observation tasks of the operators and the maintenance crew as they will only need to review the date of previous and next service appeared on the sticker and will inform the maintenance staff to perform the routine maintenance tasks on the machines. In addition, the machine operators should be trained in quality control and assurance so that if there is any change in the process, they should inform the quality supervisor on time. Proper implementation of these suggestions will help out in eradicating the changes in the process. 4. What are the sources of problem? Root causes? Which tool was used to determine the sources and the root causes of the problem by the team? (3 Mark) 5. How do they suggest to remove the cause of the waste? (2 Mark) 6. How can we sustain these actions according to you? (1 Mark)Step by Step Solution
There are 3 Steps involved in it
1 Expert Approved Answer
Step: 1 Unlock

Question Has Been Solved by an Expert!
Get step-by-step solutions from verified subject matter experts
Step: 2 Unlock
Step: 3 Unlock