

Question: Please answer the questions below 2. In a study of reaction times to a visual stimulus and the response time to an auditory stimulus were
Please answer the questions below
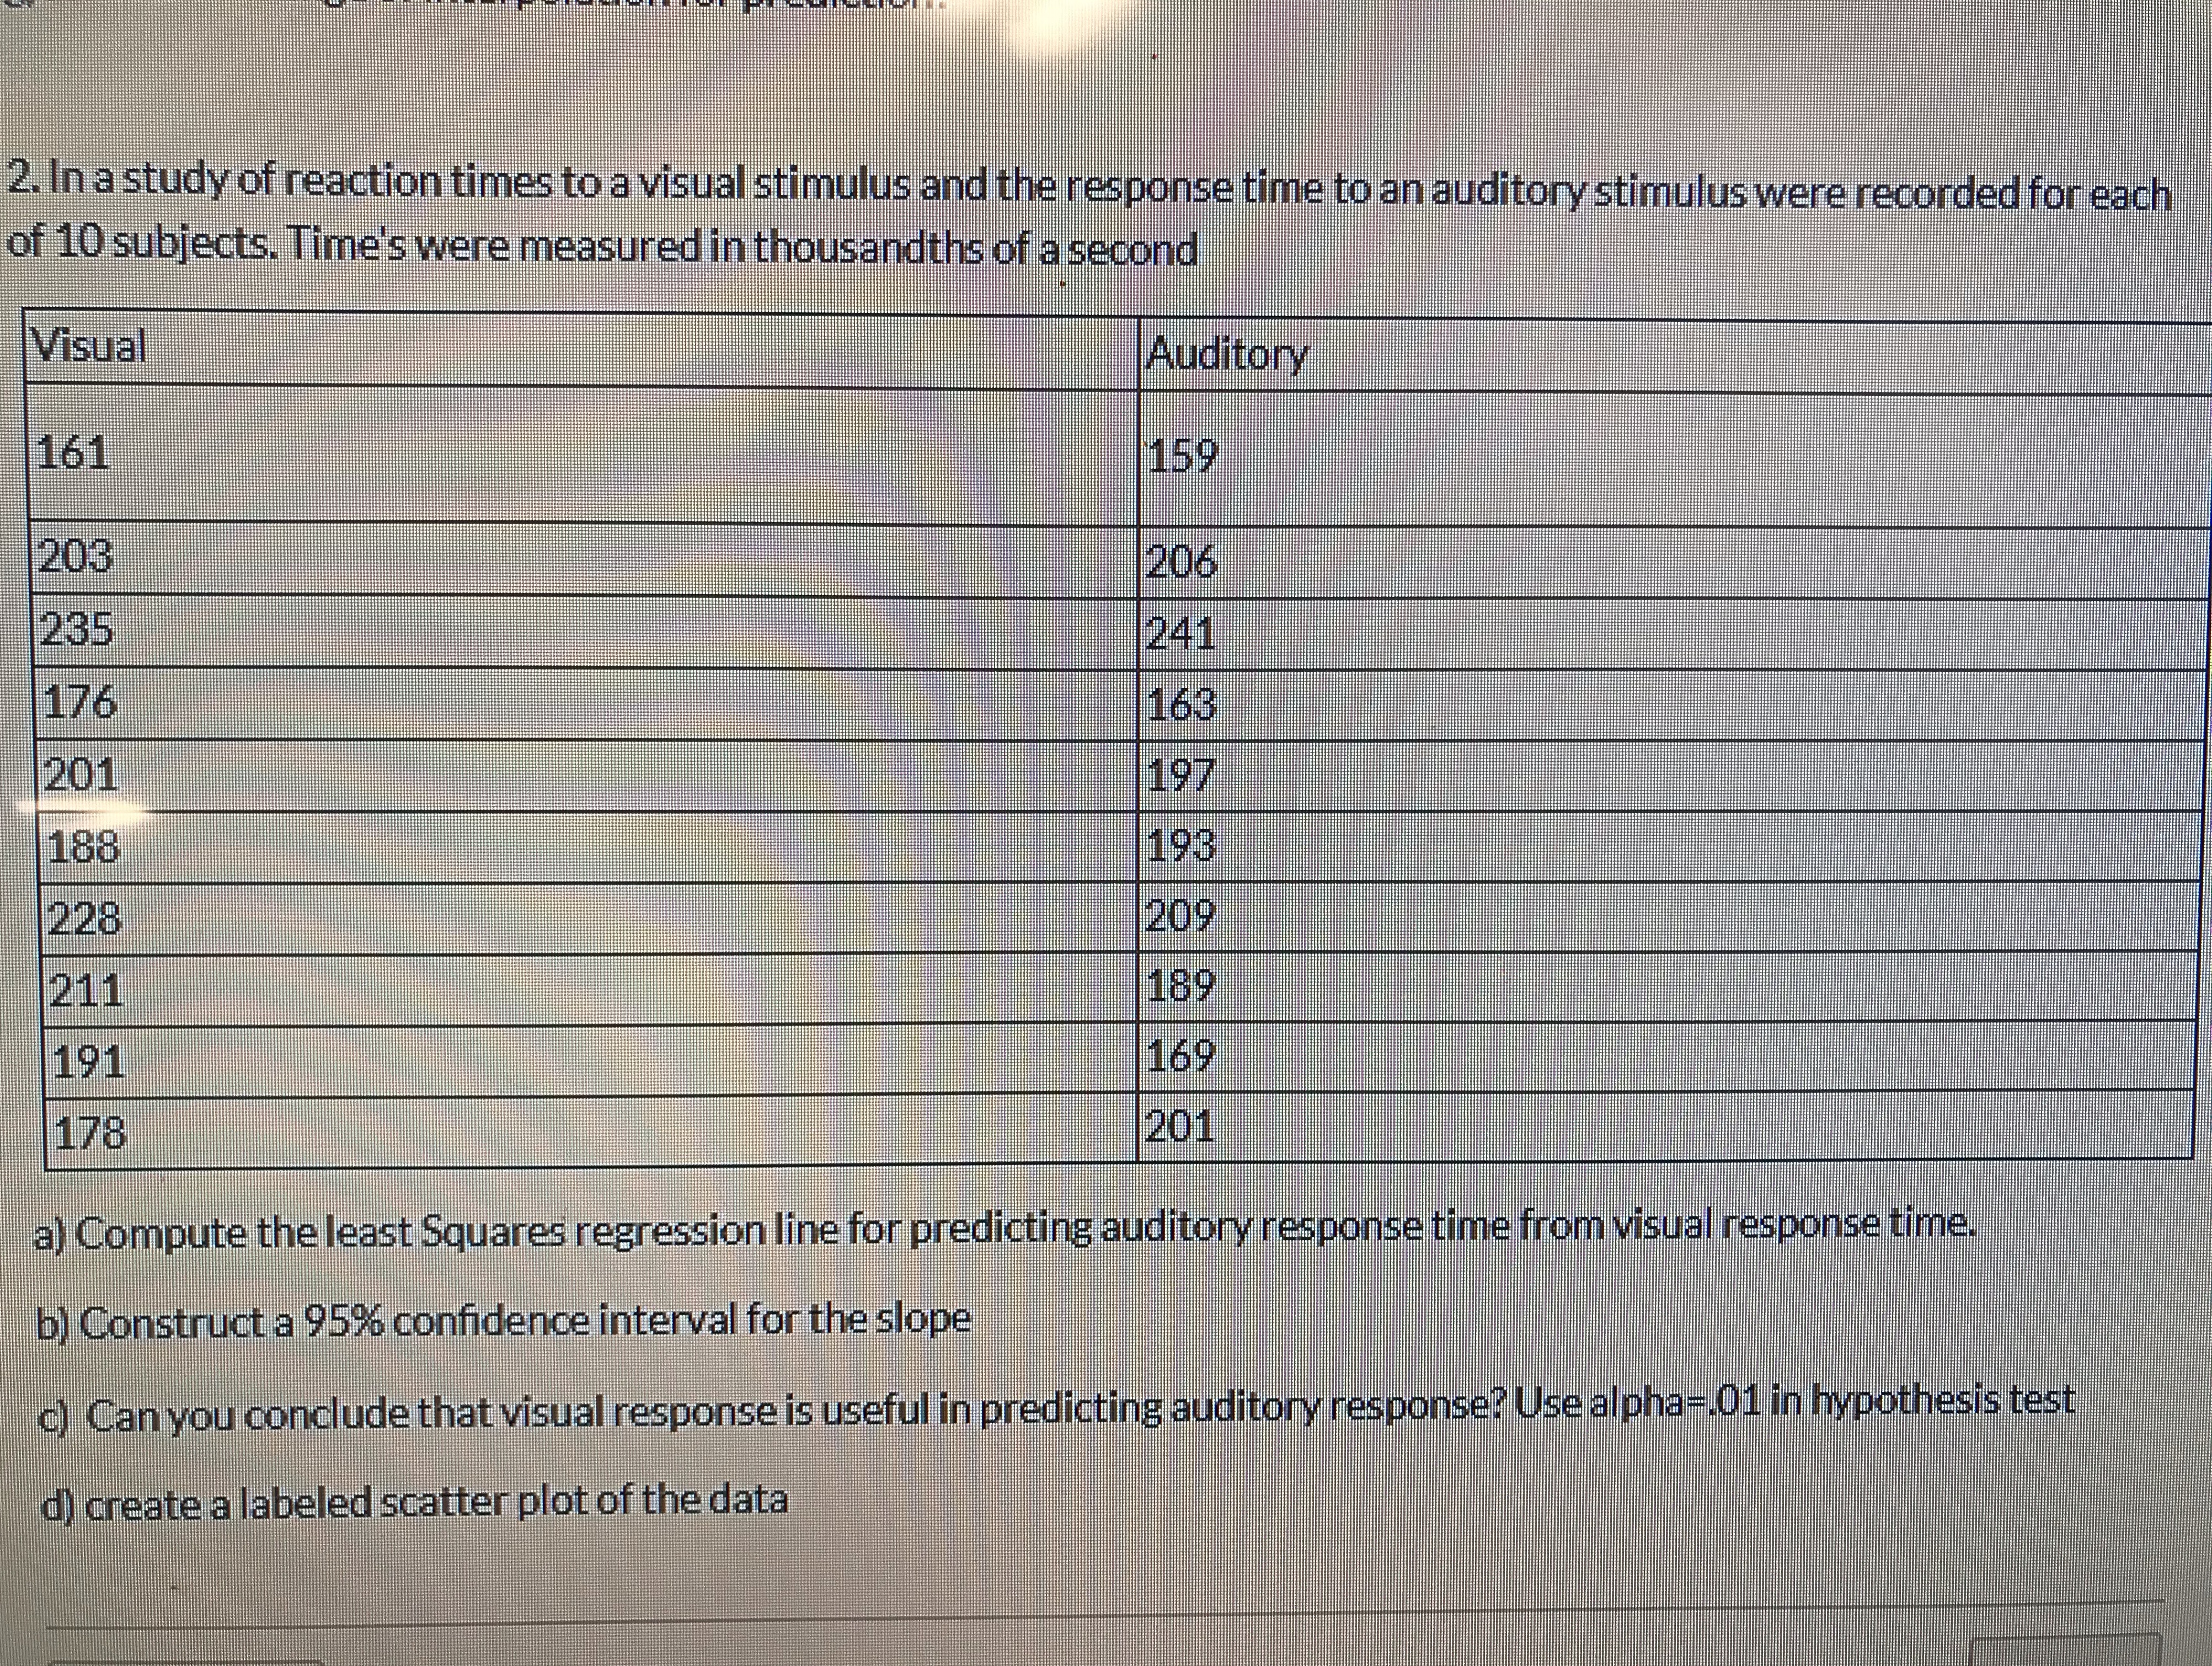
2. In a study of reaction times to a visual stimulus and the response time to an auditory stimulus were recorded for each of 10 subjects. Time's were measured in thousandths of a second Visual Auditory 161 159 203 206 235 241 176 163 201 197 188 193 228 209 211 189 191 169 178 201 a) Compute the least Squares regression line for predicting auditory response time from visual response time. b) Construct a 95% confidence interval for the slope c) Can you conclude that visual response is useful in predicting auditor/ response? Use alpha-.01 in hypothesis test d) create a labeled scatter plot of the data
Step by Step Solution
There are 3 Steps involved in it
1 Expert Approved Answer
Step: 1 Unlock

Question Has Been Solved by an Expert!
Get step-by-step solutions from verified subject matter experts
Step: 2 Unlock
Step: 3 Unlock