Question: please answer the simulation mode 4-30 Patients arrive to a 24-hour, 7-days-a-week outpatient clinic with interarrival times being distributed as exponential with mean 5.95 (all
 please answer the simulation mode
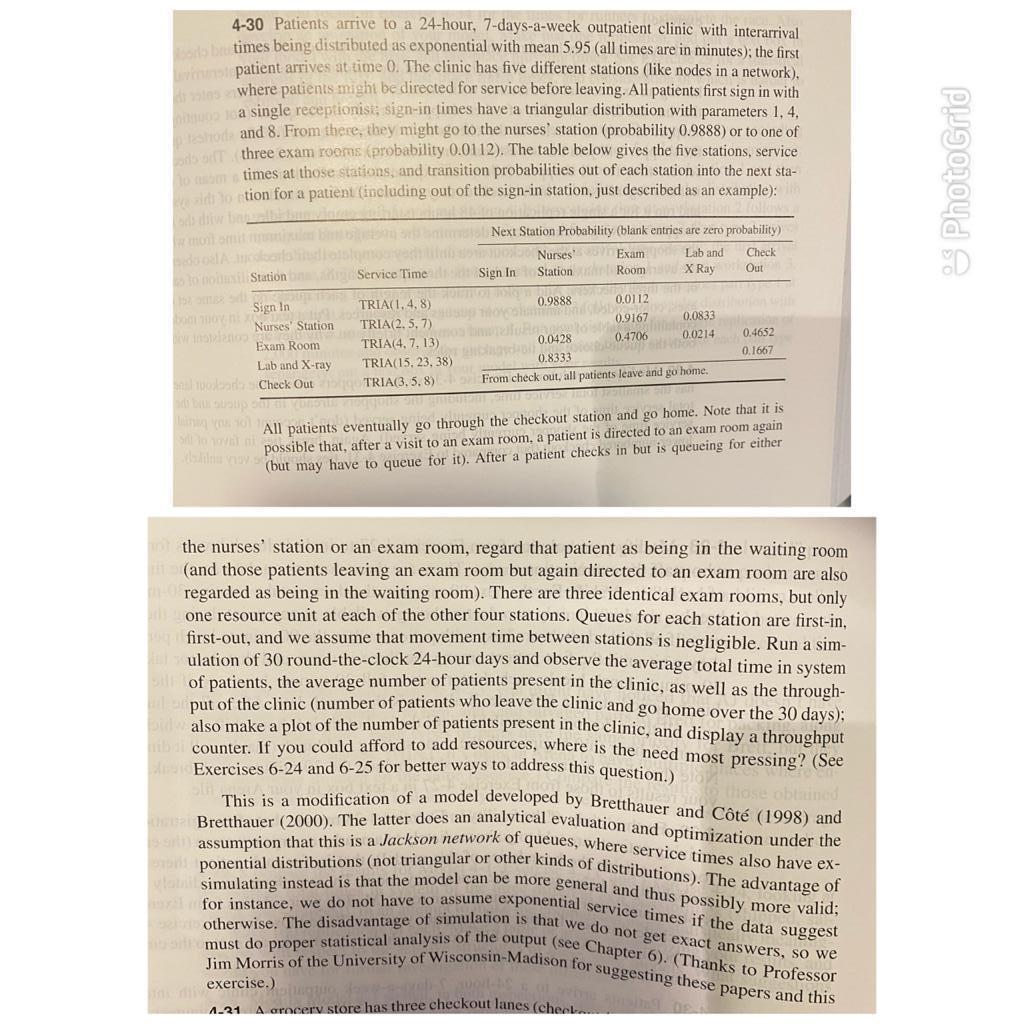
4-30 Patients arrive to a 24-hour, 7-days-a-week outpatient clinic with interarrival times being distributed as exponential with mean 5.95 (all times are in minutes); the first mis patient arrives at time 0. The clinic has five different stations (like nodes in a network), les where patients might be directed for service before leaving. All patients first sign in with ob a single receptionist; sign-in times have a triangular distribution with parameters 1, 4, and 8. From there, they might go to the nurses' station (probability 0.9888) or to one of on three exam rooms (probability 0.0112). The table below gives the five stations, service times at those stations, and transition probabilities out of each station into the next sta- ali to tion for a patient (including out of the sign-in station, just described as an example): og PhotoGrid Next Station Probability (blank entries are zero probability) Nurses' Exam Lab and Check Station Room X Ray Out Do Station Service TimeSign In 0.9888 0.0112 Sign In Nurses' Station TRIA(1,4,8) TRIA(2.5, 7) 0.0833 oblatio Exam Room 0.9167 0.4706 0.0214 0.4652 TRIA(4, 7, 13) 0.0428 0.8333 0.1667 TRIA(15. 23, 38) Lab and X-ray headh Check Out TRIA(3.5.8) From check out, all patients leave and go home. All patients eventually go through the checkout station and go home. Note that it is possible that, after a visit to an exam room, a patient is directed to an exam room again the nurses' station or an exam room, regard that patient as being in the waiting room (and those patients leaving an exam room but again directed to an exam room are also regarded as being in the waiting room). There are three identical exam rooms, but only one resource unit at each of the other four stations. Queues for each station are first-in, first-out, and we assume that movement time between stations is negligible. Run a sim- ulation of 30 round-the-clock 24-hour days and observe the average total time in system Bill of patients, the average number of patients present in the clinic, as well as the through- put of the clinic (number of patients who leave the clinic and go home over the 30 days); also make a plot of the number of patients present in the clinic, and display a throughput counter. If you could afford to add resources, where is the need most pressing? (See de Exercises 6-24 and 6-25 for better ways to address this question.) This is a modification of a model developed by Bretthauer and Ct (1998) and Bretthauer (2000). The latter does assumption that this is a Jackson network of queues, where service times also have ex- ponential distributions (not triangular or other kinds of distributions). The advantage of simulating instead is that the model can be more general and thus possibly more valid; for instance, we do not have to assume exponential service times if the data suggest otherwise. The disadvantage of simulation is that we do not get exact answers, so we must do proper statistical analysis of the output (see Chapter 6). (Thanks to Professor Jim Morris of the University of Wisconsin-Madison for suggesting these papers and this exercise.) el 1-21 Agrocery store has three checkout lanes (check analytical evaluation and optimization under the 4-30 Patients arrive to a 24-hour, 7-days-a-week outpatient clinic with interarrival times being distributed as exponential with mean 5.95 (all times are in minutes); the first mis patient arrives at time 0. The clinic has five different stations (like nodes in a network), les where patients might be directed for service before leaving. All patients first sign in with ob a single receptionist; sign-in times have a triangular distribution with parameters 1, 4, and 8. From there, they might go to the nurses' station (probability 0.9888) or to one of on three exam rooms (probability 0.0112). The table below gives the five stations, service times at those stations, and transition probabilities out of each station into the next sta- ali to tion for a patient (including out of the sign-in station, just described as an example): og PhotoGrid Next Station Probability (blank entries are zero probability) Nurses' Exam Lab and Check Station Room X Ray Out Do Station Service TimeSign In 0.9888 0.0112 Sign In Nurses' Station TRIA(1,4,8) TRIA(2.5, 7) 0.0833 oblatio Exam Room 0.9167 0.4706 0.0214 0.4652 TRIA(4, 7, 13) 0.0428 0.8333 0.1667 TRIA(15. 23, 38) Lab and X-ray headh Check Out TRIA(3.5.8) From check out, all patients leave and go home. All patients eventually go through the checkout station and go home. Note that it is possible that, after a visit to an exam room, a patient is directed to an exam room again the nurses' station or an exam room, regard that patient as being in the waiting room (and those patients leaving an exam room but again directed to an exam room are also regarded as being in the waiting room). There are three identical exam rooms, but only one resource unit at each of the other four stations. Queues for each station are first-in, first-out, and we assume that movement time between stations is negligible. Run a sim- ulation of 30 round-the-clock 24-hour days and observe the average total time in system Bill of patients, the average number of patients present in the clinic, as well as the through- put of the clinic (number of patients who leave the clinic and go home over the 30 days); also make a plot of the number of patients present in the clinic, and display a throughput counter. If you could afford to add resources, where is the need most pressing? (See de Exercises 6-24 and 6-25 for better ways to address this question.) This is a modification of a model developed by Bretthauer and Ct (1998) and Bretthauer (2000). The latter does assumption that this is a Jackson network of queues, where service times also have ex- ponential distributions (not triangular or other kinds of distributions). The advantage of simulating instead is that the model can be more general and thus possibly more valid; for instance, we do not have to assume exponential service times if the data suggest otherwise. The disadvantage of simulation is that we do not get exact answers, so we must do proper statistical analysis of the output (see Chapter 6). (Thanks to Professor Jim Morris of the University of Wisconsin-Madison for suggesting these papers and this exercise.) el 1-21 Agrocery store has three checkout lanes (check analytical evaluation and optimization under the


