

Question: Please answer these questions based off the data of the image attached. This data is from a test where I played a videogame 20 times
Please answer these questions based off the data of the image attached. This data is from a test where I played a videogame 20 times to see which variable had the greatest influence on my gaming skills.(These questions are easy to answer through Stat Crunch)
Questions:
- Design a scatter plot with the regression line included. Improve the title, scale, and labeling of the axes as necessary. Include the sample size, population, and correlation coefficient.
2.Identify the direction of association. Make a sentence that interprets this relationship.
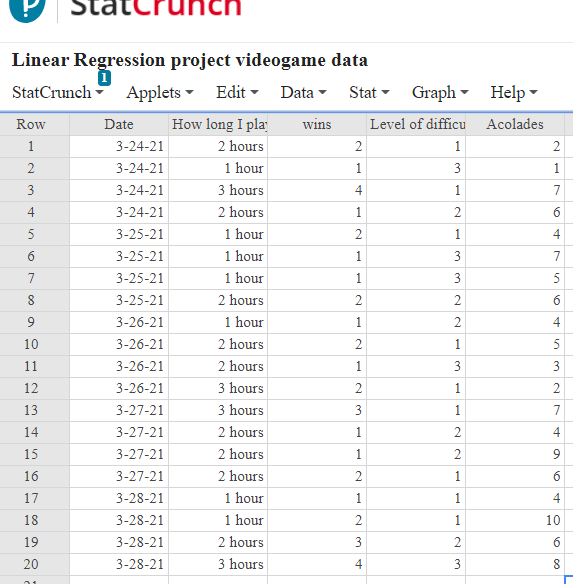
Statcrunch Linear Regression project videogame data 1 StatCrunch Applets ~ Edit - Data - Stat Graph - Help - Row Date How long I play wins Level of difficu Acolades 3-24-21 2 hours 2 3-24-21 1 hour 3-24-21 3 hours 4 3-24-21 2 hours 6 3-25-21 1 hour 2 4 3-25-21 1 hour 3-25-21 1 hour 8 3-25-21 2 hours 3-26-21 1 hour 10 3-26-21 2 hours 11 3-26-21 2 hours 12 3-26-21 3 hours 2 13 3-27-21 3 hours 3 14 3-27-21 2 hours 4 15 3-27-21 2 hours 16 3-27-21 2 hours 2 6 17 3-28-21 1 hour 4 18 3-28-21 1 hour 10 W N PA 19 3-28-21 2 hours 20 3-28-21 3 hours 4
Step by Step Solution
There are 3 Steps involved in it

Get step-by-step solutions from verified subject matter experts