

Question: Please answer these questions using excel Excel Moule Pertoning Coutations with Fords and Functions Liana will suspect machine stoment when the water tre ochot water
Please answer these questions using excel
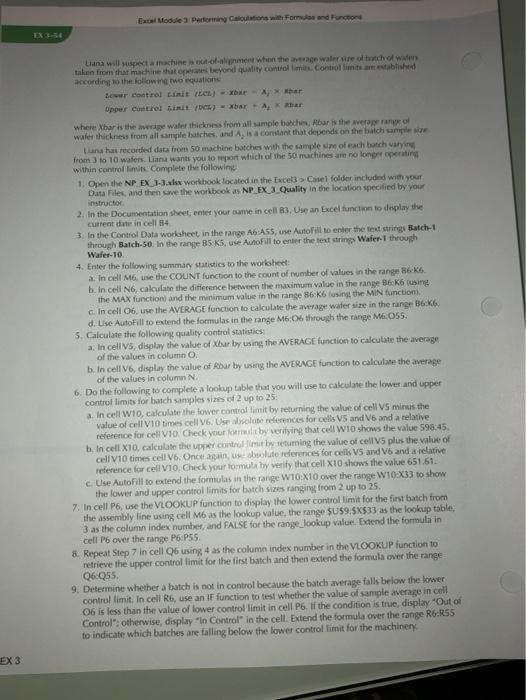
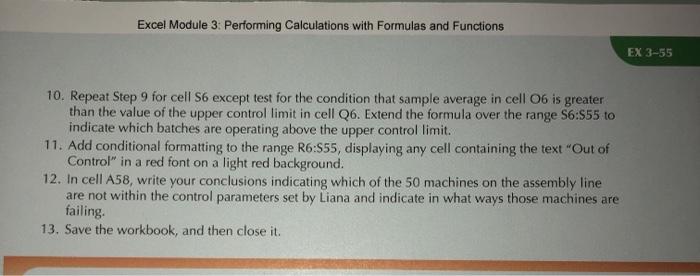
Excel Moule Pertoning Coutations with Fords and Functions Liana will suspect machine stoment when the water tre ochot water taken from that machine that opees beyond quality control Controllimitablished according to the following two equation Lover Control Limit (LL) - Opper Control LED) - Xbar A har where Xbar is the average water thickness from all sample batches. Aburs the average of water thickness from all complebuches, and A, is a constant that depends on the bach sample Luna has recorded data from 50 machine batches with the samplesime of each batch varying from 3 to 10 wafers Liane wants you to report which of the 50 machines are no longer penting within controllimis. Complete the following 1. Open the NP EX 1.3.xlsx workbook located in the Exce3 Case folder included with your Data Files, and then save the workbook as NP EX Quality in the location specified by your instructor 2. In the Documentation sheet met your came in cell 3. Use an Excel function to deplay the current date in cell 14 3. In the Control Data worloheet in the range A6 ASS, use Autofill to enter the test string Batch-1 through Batch-50. In the range 85 K5, use AutoFill to enter the text string Wafer through Wafer-10 4. Enter the following summary statistics the worksheet a. In cell M6, use the COUNT function to the count of number of values in the range B b. In cell N6, calculate the difference between the maximum value in the range BK6 using the MAX function and the minimum value in the range 86 K6 lusing the MIN function. c. In cell 06, use the AVERAGE function to calculate the average watersire in the range B6 K6 d. Use AutoFill to extend the formulas in the range M6:06 through the ringe Me:O55. 5. Calculate the following quality control statistics a. In cell V5, display the value of Xbar by using the AVERAGE function to calculate the average of the values in column b. In cell V6, display the value of Rbar by using the AVERAGE function to calculate the average of the values in column N. 6. Do the following to complete a lookup table that you will use to calculate the lower and upper controllimits for batch samples sizes of 2 up to 25 a. In cell wio, calculate the lower controllimit by returning the value of cell VS minus the value of cell V10 times cell V6: Use olite references for cells V5 and V6 and a relative reference for cell V10 Check your or by verifying that cell WIo shows the value 598.45 b. In cell X10, calculate the upper controllimit retuming the value of cell V5 plus the value of cell V10 times cell V6. Once again, lute erences for cells Vs and V6 and a relative reference for cell VIO. Check your formula by verify that cell X10 shows the value 651612 c. Use Auto fill to extend the formulas in the range W10:X10 over the range W10X33to show the lower and upper controllimits for batch sizes ranging from 2 up to 25. 7. In cell P6, use the VLOOKUP function to display the lower controllimit for the first batch from the assembly line using cell M6 as the lookup value, the range $U$9:$X$33 as the lookup table, 3 as the column index number, and FALSE for the range_lookup value Extend the formula in cell P over the range P6-P55 8. Repeat Step 7 in cell 6 using 4 as the column index number in the VLOOKUP function to retrieve the upper controllimit for the first batch and then extend the formula over the range Q6:055 9. Determine whether a batch is not in control because the batch average falls below the lower controllimit. In cell R6, use an IF function to test whether the value of sample average in cell 06 is less than the value of lower controllimit in cell P t the condition is true, display "Out of Control: otherwise, display "In Control in the cell. Extend the formula over the range R6:55 to indicate which batches are falling below the lower controllimit for the machinery EX 3 Excel Module 3: Performing Calculations with Formulas and Functions EX 3-55 10. Repeat Step 9 for cell S6 except test for the condition that sample average in cell 06 is greater than the value of the upper control limit in cell Q6. Extend the formula over the range S6:555 to indicate which batches are operating above the upper control limit. 11. Add conditional formatting to the range R6:555, displaying any cell containing the text "Out of Control" in a red font on a light red background. 12. In cell A58, write your conclusions indicating which of the 50 machines on the assembly line are not within the control parameters set by Liana and indicate in what ways those machines are failing. 13. Save the workbook, and then close it. Excel Moule Pertoning Coutations with Fords and Functions Liana will suspect machine stoment when the water tre ochot water taken from that machine that opees beyond quality control Controllimitablished according to the following two equation Lover Control Limit (LL) - Opper Control LED) - Xbar A har where Xbar is the average water thickness from all sample batches. Aburs the average of water thickness from all complebuches, and A, is a constant that depends on the bach sample Luna has recorded data from 50 machine batches with the samplesime of each batch varying from 3 to 10 wafers Liane wants you to report which of the 50 machines are no longer penting within controllimis. Complete the following 1. Open the NP EX 1.3.xlsx workbook located in the Exce3 Case folder included with your Data Files, and then save the workbook as NP EX Quality in the location specified by your instructor 2. In the Documentation sheet met your came in cell 3. Use an Excel function to deplay the current date in cell 14 3. In the Control Data worloheet in the range A6 ASS, use Autofill to enter the test string Batch-1 through Batch-50. In the range 85 K5, use AutoFill to enter the text string Wafer through Wafer-10 4. Enter the following summary statistics the worksheet a. In cell M6, use the COUNT function to the count of number of values in the range B b. In cell N6, calculate the difference between the maximum value in the range BK6 using the MAX function and the minimum value in the range 86 K6 lusing the MIN function. c. In cell 06, use the AVERAGE function to calculate the average watersire in the range B6 K6 d. Use AutoFill to extend the formulas in the range M6:06 through the ringe Me:O55. 5. Calculate the following quality control statistics a. In cell V5, display the value of Xbar by using the AVERAGE function to calculate the average of the values in column b. In cell V6, display the value of Rbar by using the AVERAGE function to calculate the average of the values in column N. 6. Do the following to complete a lookup table that you will use to calculate the lower and upper controllimits for batch samples sizes of 2 up to 25 a. In cell wio, calculate the lower controllimit by returning the value of cell VS minus the value of cell V10 times cell V6: Use olite references for cells V5 and V6 and a relative reference for cell V10 Check your or by verifying that cell WIo shows the value 598.45 b. In cell X10, calculate the upper controllimit retuming the value of cell V5 plus the value of cell V10 times cell V6. Once again, lute erences for cells Vs and V6 and a relative reference for cell VIO. Check your formula by verify that cell X10 shows the value 651612 c. Use Auto fill to extend the formulas in the range W10:X10 over the range W10X33to show the lower and upper controllimits for batch sizes ranging from 2 up to 25. 7. In cell P6, use the VLOOKUP function to display the lower controllimit for the first batch from the assembly line using cell M6 as the lookup value, the range $U$9:$X$33 as the lookup table, 3 as the column index number, and FALSE for the range_lookup value Extend the formula in cell P over the range P6-P55 8. Repeat Step 7 in cell 6 using 4 as the column index number in the VLOOKUP function to retrieve the upper controllimit for the first batch and then extend the formula over the range Q6:055 9. Determine whether a batch is not in control because the batch average falls below the lower controllimit. In cell R6, use an IF function to test whether the value of sample average in cell 06 is less than the value of lower controllimit in cell P t the condition is true, display "Out of Control: otherwise, display "In Control in the cell. Extend the formula over the range R6:55 to indicate which batches are falling below the lower controllimit for the machinery EX 3 Excel Module 3: Performing Calculations with Formulas and Functions EX 3-55 10. Repeat Step 9 for cell S6 except test for the condition that sample average in cell 06 is greater than the value of the upper control limit in cell Q6. Extend the formula over the range S6:555 to indicate which batches are operating above the upper control limit. 11. Add conditional formatting to the range R6:555, displaying any cell containing the text "Out of Control" in a red font on a light red background. 12. In cell A58, write your conclusions indicating which of the 50 machines on the assembly line are not within the control parameters set by Liana and indicate in what ways those machines are failing. 13. Save the workbook, and then close it
Step by Step Solution
There are 3 Steps involved in it

Get step-by-step solutions from verified subject matter experts