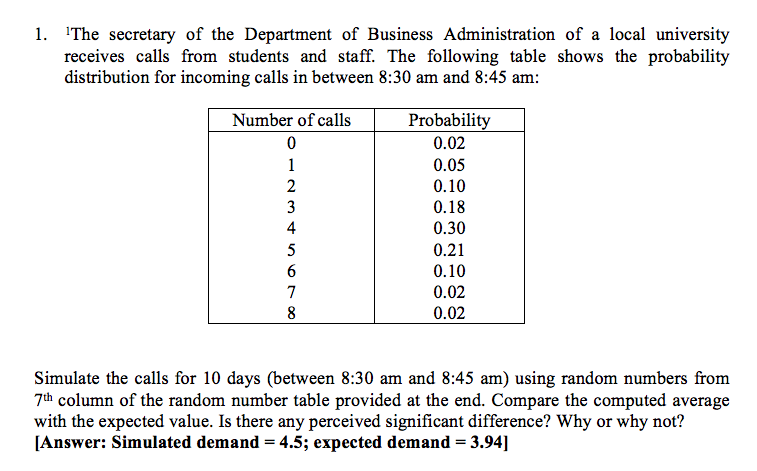
Question: please answer this manually by using random number table, step by step..thanks :) The secretary of the Department of Business Administration of a local university

please answer this manually by using random please answer this manually by using randomplease answer this manually by using random number table, step by step..thanks :)

The secretary of the Department of Business Administration of a local university receives calls from students and staff. The following table shows the probability distribution for incoming calls in between 8:30 am and 8:45 am: Number of calls Probability 0.02 0.05 0.10 OnMinor 0.18 0.30 0.21 0.10 0.02 0.02 Simulate the calls for 10 days (between 8:30 am and 8:45 am) using random numbers from 7th column of the random number table provided at the end. Compare the computed average with the expected value. Is there any perceived significant difference? Why or why not? [Answer: Simulated demand = 4.5; expected demand = 3.94] Random Number table 44 90 156 46 35 06 21 09 66 11 AS OS 56 88 39 79 76 21 11 1 96 23 56 66 85 | 22 | 92 82 78 60 106 | 14 20 66 0 98 7 45 1 67 83 89 18 33 98 21 37 14 38 06 71 76 11 124 49 36 33 | 61 | 56 169 3 21 22 0 87 05 88 40 74 111 99 31 | 16 18 35 14 63 11 28 30 02 94 38 50 52 08 49 11 21 13 | 56 23 118 61 43 14 61 26 63 83 66 39 83 92 54 19 95 42 53 50 62 131 SS 61 13 33 21 27 79 67 22 | 169 21 79 58 42 83 59 40 26 73 05 27 54 | 35 18 31 41 90 55 55 30 156 | 93 | 33 07 60 | 88 22 01 | 56 35 35 22 16 52 45 75 1 58 52 | 54 29 58 26 192 10 35 98 09 24 12 14 25 82 | 16 60 83 01 76 91 | 10 45 19 63 45 83 31 | 30 75 89 49 13 Fa%85 BAR STA RSS aia 18815 AEST 25 09 20 15 09 75 | 97 28 82 49 89 82 48 73 54 32 13 71 79 02 01 62 69 66 62 | 52 130 188 81 83 97 23 | 96 76 42 16 49 88 03 183 | 20 SS | 07 09 94 36 37 73 88 62 48 59 49 43 45 77 40 10 SS | 80 42 69 71 26 08 | 16 | | 21 1 88 SS 64 | 76 30 39 49 195 | 10 77 141 79 31 17 63 91 40 33 40 60 74 37 3 51 52 88 42 32 | 56 | 40 | 24 | 33 50 28 97 40 47 37 42 37 89 62 66 0 27 83 40 69 07 07 83 36 931 701 1 56 09 53 49 88 34 25 62 52 35 99 20 43 01 11 33 97 12 50 17 73 71 63 82 42 43 72 | 64 | 17 25 26 65 62 89 27 11 88 92 60 05 | 59 03 44 S7 16 84 26 51 86 95 | 62 | 63 | | 60 63 15 48 99 55 76 38 05 03 65 66 26 16 36 23 | 73 26 38 | 82 78 29 961 The secretary of the Department of Business Administration of a local university receives calls from students and staff. The following table shows the probability distribution for incoming calls in between 8:30 am and 8:45 am: Number of calls Probability 0.02 0.05 0.10 OnMinor 0.18 0.30 0.21 0.10 0.02 0.02 Simulate the calls for 10 days (between 8:30 am and 8:45 am) using random numbers from 7th column of the random number table provided at the end. Compare the computed average with the expected value. Is there any perceived significant difference? Why or why not? [Answer: Simulated demand = 4.5; expected demand = 3.94] Random Number table 44 90 156 46 35 06 21 09 66 11 AS OS 56 88 39 79 76 21 11 1 96 23 56 66 85 | 22 | 92 82 78 60 106 | 14 20 66 0 98 7 45 1 67 83 89 18 33 98 21 37 14 38 06 71 76 11 124 49 36 33 | 61 | 56 169 3 21 22 0 87 05 88 40 74 111 99 31 | 16 18 35 14 63 11 28 30 02 94 38 50 52 08 49 11 21 13 | 56 23 118 61 43 14 61 26 63 83 66 39 83 92 54 19 95 42 53 50 62 131 SS 61 13 33 21 27 79 67 22 | 169 21 79 58 42 83 59 40 26 73 05 27 54 | 35 18 31 41 90 55 55 30 156 | 93 | 33 07 60 | 88 22 01 | 56 35 35 22 16 52 45 75 1 58 52 | 54 29 58 26 192 10 35 98 09 24 12 14 25 82 | 16 60 83 01 76 91 | 10 45 19 63 45 83 31 | 30 75 89 49 13 Fa%85 BAR STA RSS aia 18815 AEST 25 09 20 15 09 75 | 97 28 82 49 89 82 48 73 54 32 13 71 79 02 01 62 69 66 62 | 52 130 188 81 83 97 23 | 96 76 42 16 49 88 03 183 | 20 SS | 07 09 94 36 37 73 88 62 48 59 49 43 45 77 40 10 SS | 80 42 69 71 26 08 | 16 | | 21 1 88 SS 64 | 76 30 39 49 195 | 10 77 141 79 31 17 63 91 40 33 40 60 74 37 3 51 52 88 42 32 | 56 | 40 | 24 | 33 50 28 97 40 47 37 42 37 89 62 66 0 27 83 40 69 07 07 83 36 931 701 1 56 09 53 49 88 34 25 62 52 35 99 20 43 01 11 33 97 12 50 17 73 71 63 82 42 43 72 | 64 | 17 25 26 65 62 89 27 11 88 92 60 05 | 59 03 44 S7 16 84 26 51 86 95 | 62 | 63 | | 60 63 15 48 99 55 76 38 05 03 65 66 26 16 36 23 | 73 26 38 | 82 78 29 961

Step by Step Solution

There are 3 Steps involved in it

1 Expert Approved Answer
Step: 1 Unlock blur-text-image
Question Has Been Solved by an Expert!

Get step-by-step solutions from verified subject matter experts

Step: 2 Unlock
Step: 3 Unlock

Students Have Also Explored These Related General Management Questions!