

Question: Please answer this question and draw all the graphs. Thank you Q5. A government is planning to organise public fireworks. Their analysists split the population
Please answer this question and draw all the graphs. Thank you
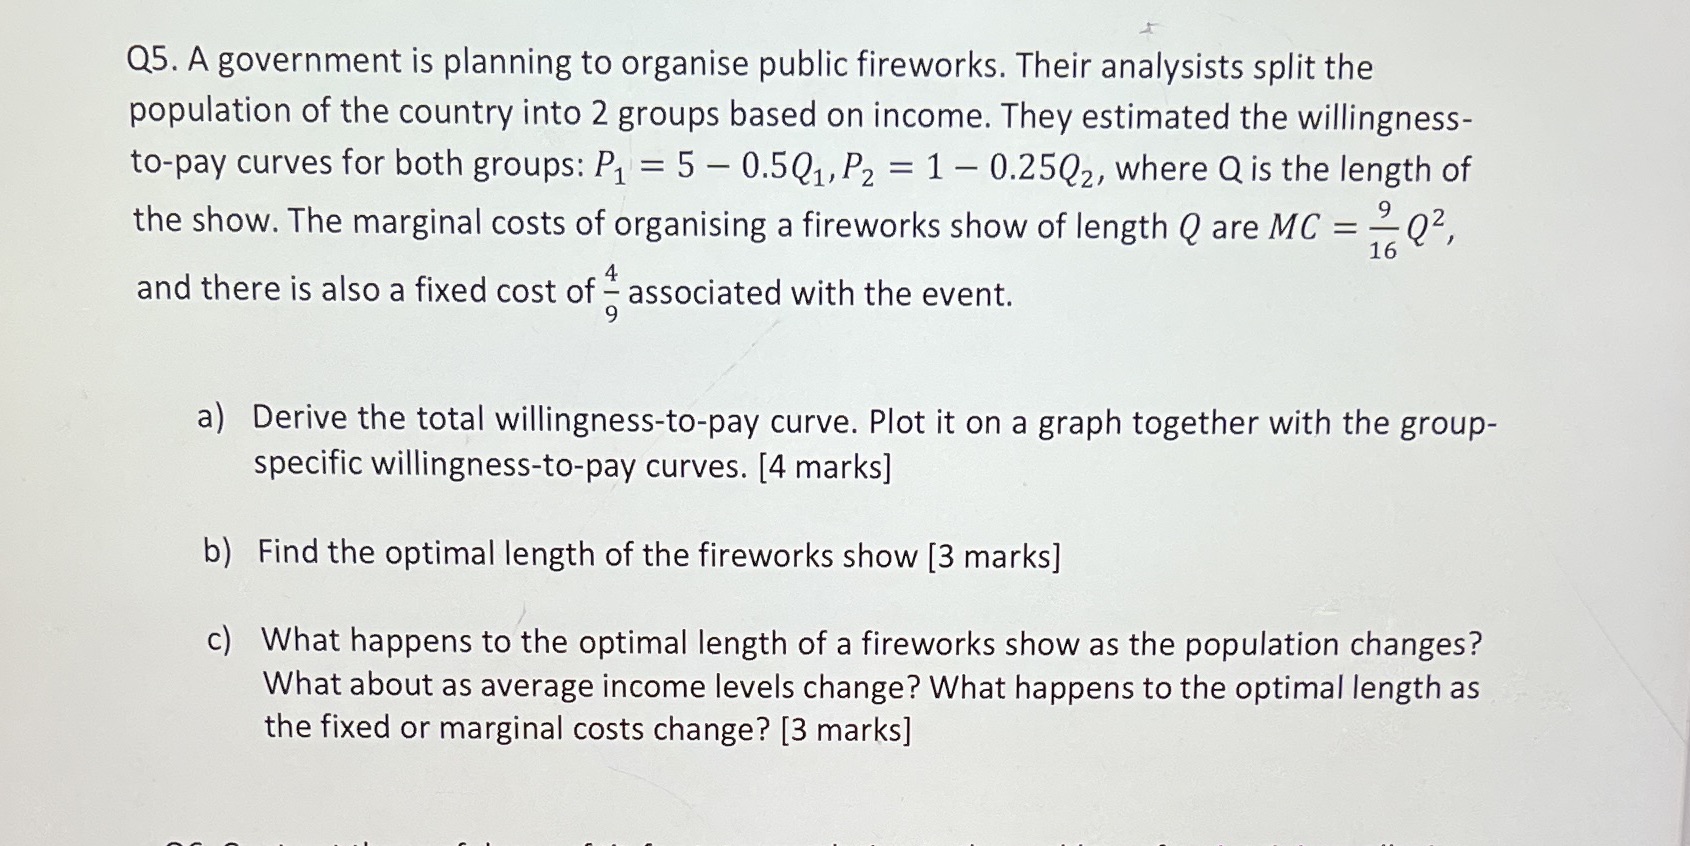
Q5. A government is planning to organise public fireworks. Their analysists split the population of the country into 2 groups based on income. They estimated the willingness- to-pay curves for both groups: P1 = 5 - 0.501, P2 = 1 - 0.2502, where Q is the length of the show. The marginal costs of organising a fireworks show of length Q are MC = = Q2 and there is also a fixed cost of = associated with the event. a) Derive the total willingness-to-pay curve. Plot it on a graph together with the group- specific willingness-to-pay curves. [4 marks] b) Find the optimal length of the fireworks show [3 marks] c) What happens to the optimal length of a fireworks show as the population changes? What about as average income levels change? What happens to the optimal length as the fixed or marginal costs change? [3 marks]
Step by Step Solution
There are 3 Steps involved in it

Get step-by-step solutions from verified subject matter experts