

Question: Please answer this question fully and clearly. Regards 6. The following figure shows the plot of a function fun(x)-f (x(1),x (2)): -3 1.5 1.5 0.5
 Please answer this question fully and clearly. Regards
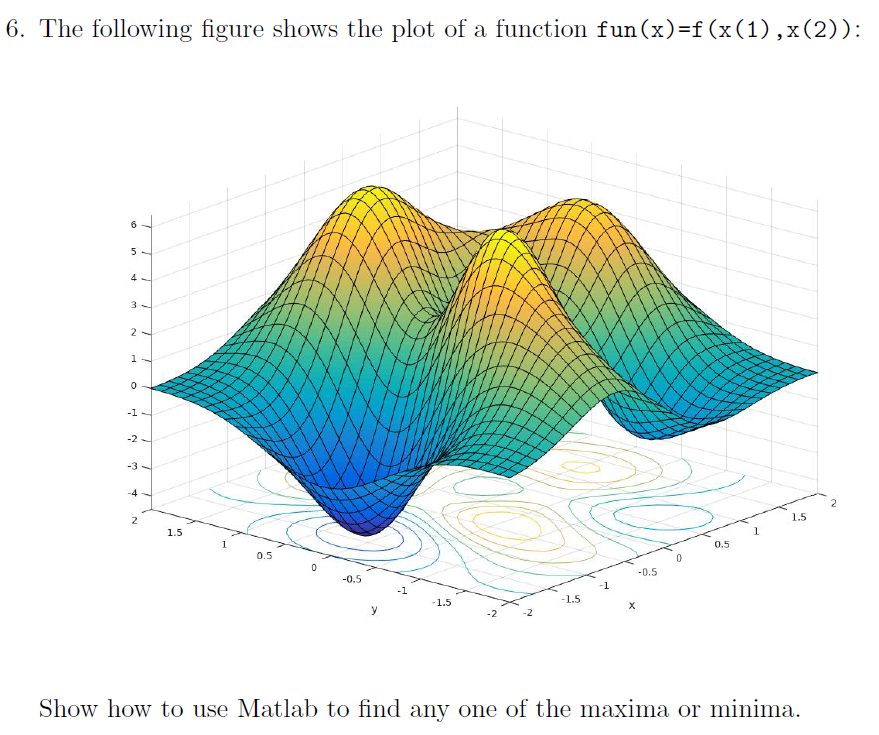
6. The following figure shows the plot of a function fun(x)-f (x(1),x (2)): -3 1.5 1.5 0.5 0.5 -0.5 -0.5 1.5 1.5 Show how to use Matlab to find any one of the maxima or minima. 6. The following figure shows the plot of a function fun(x)-f (x(1),x (2)): -3 1.5 1.5 0.5 0.5 -0.5 -0.5 1.5 1.5 Show how to use Matlab to find any one of the maxima or minima
Step by Step Solution
There are 3 Steps involved in it
1 Expert Approved Answer
Step: 1 Unlock

Question Has Been Solved by an Expert!
Get step-by-step solutions from verified subject matter experts
Step: 2 Unlock
Step: 3 Unlock