

Question: Please answer this question using MATLAB, Importantly I need help on the second vector. 10. The following data points are the daily maximum temperature (in
Please answer this question using MATLAB, Importantly I need help on the second vector.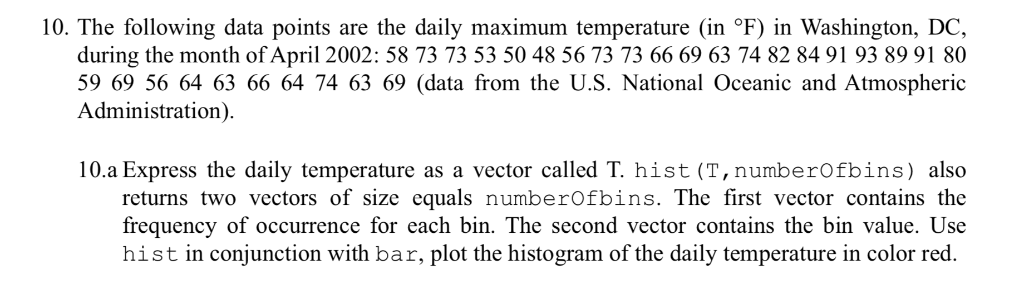
10. The following data points are the daily maximum temperature (in F) in Washington, DC, during the month of April 2002: 58 73 73 53 50 48 56 73 73 66 69 63 74 82 84 91 93 89 91 80 59 69 56 64 63 66 64 74 63 69 (data from the U.S. National Oceanic and Atmospheric Administration) 10.a Express the daily temperature as a vector called T. hist (T,numberOfbins) also returns two vectors of size equalsnumberOfbins. The first vector contains the frequency of occurrence for each bin. The second vector contains the bin value. Use hist in conjunction with bar, plot the histogram of the daily temperature in color red
Step by Step Solution
There are 3 Steps involved in it

Get step-by-step solutions from verified subject matter experts