

Question: Please answer this question using Matlab. Thank you! 7) Use mylagrange in this problem. 1614 Chapter 12. Interpolation and Approximation a) Plot the five Lagrange
Please answer this question using Matlab. Thank you!
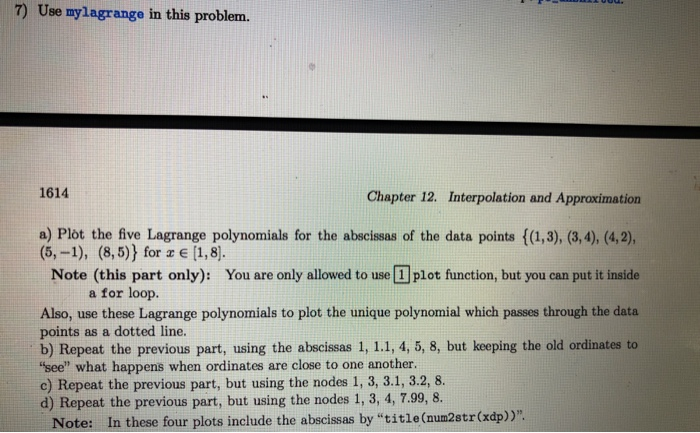
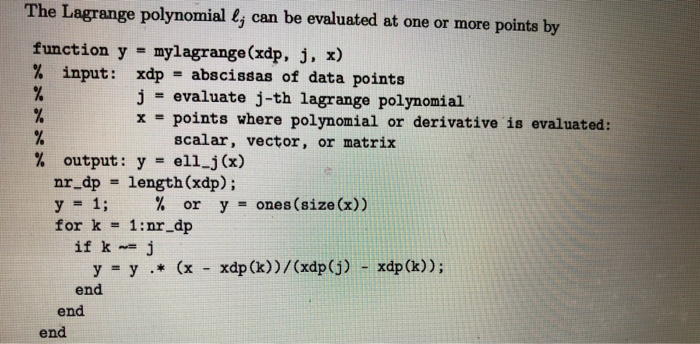
7) Use mylagrange in this problem. 1614 Chapter 12. Interpolation and Approximation a) Plot the five Lagrange polynomials for the abscissas of the data points ((1,3), (3,4), (4,2), You are only allowed to useplot function, but you can put it inside 5,-1), (8, 5) for E [1,8) Note (this part only): a for loop. Also, use these Lagrange polynomials to plot the unique polynomial which passes through the data points as a dotted line. b) Repeat the previous part, using the abscissas 1, 1.1, 4, 5, 8, but keeping the old ordinates to "see" what happens when ordinates are close to one another. c) Repeat the previous part, but using the nodes 1, 3, 3.1, 3.2, 8. d) Repeat the previous part, but using the nodes 1, 3, 4, 7.99, 8. Note: In these four plots include the abscissas by "title (num2str(xdp))" The Lagrange polynomial l, can be evaluated at one or more points by function y = mylagrange (xdp, j, x) % input : xdpse abscissas of data points j evaluate j-th lagrange polynomial x = points where polynomial or derivative is evaluated: scalar, vector, or matrix % ell-j (x) output : nr_dp = length (xdp); y-1, % y or yones (size (x)) for k 1:nr dp end end end
Step by Step Solution
There are 3 Steps involved in it

Get step-by-step solutions from verified subject matter experts