

Question: Please answer this with excel and attach the excel document Parttofl: Use the data set linked below containing repair costs at a local auto shop
Please answer this with excel and attach the excel document
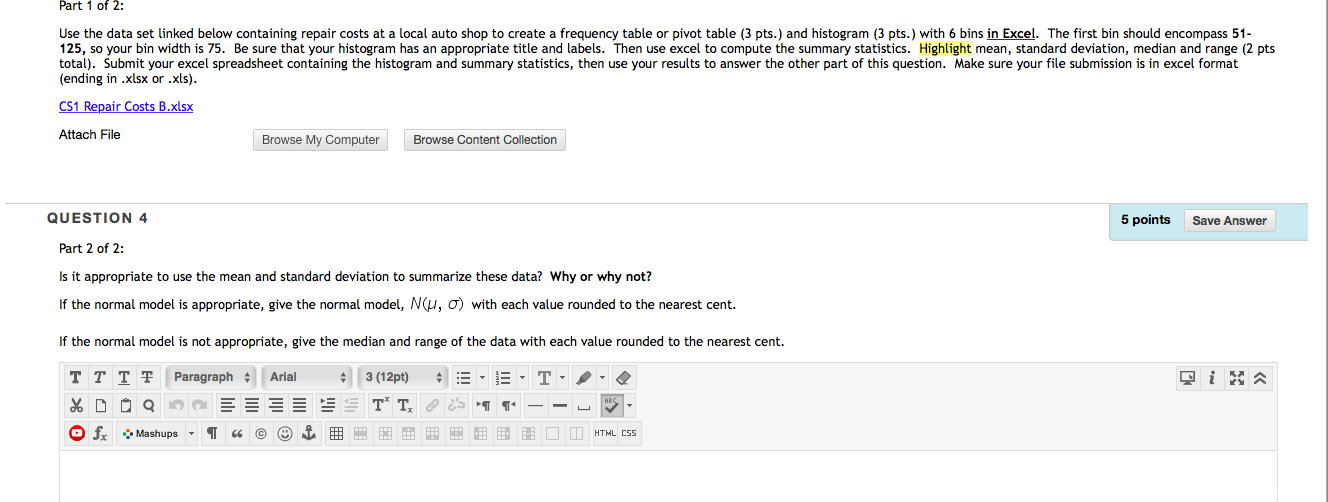
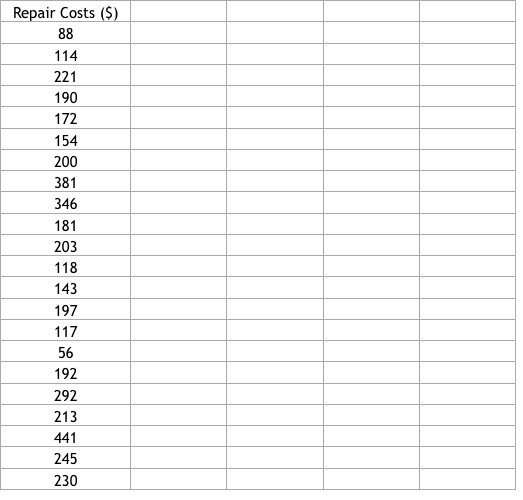
Parttofl: Use the data set linked below containing repair costs at a local auto shop to create a frequency table or pivot table (3 pts.) and histogram (3 pts.) with 6 bins in Excel. The rst bin should encompass 51- 125, so your bin width is 75. Be sure that your histogram has an appropriate title and labels. Then use excel to compute the summary statistics. Highlight mean, standard deviation. median and rarge [2 pts total). Submit your excel spreadsheet containing the histogram and summary statistic, then use your results to answer the other part of this question. Make sure your le submission is in excel format (ending in .xlsx u' .sls]. MM Mh F'le Bmwse My Computer | i Browaeconherrtmtacon QUESTION 4 ' 5poln1l in Part 1 of 2: Is it appropriate to use the mean and standard deviation to summarize these data? Why or why not? If the normal model is appropriate, give the normal model, NUJ, (I) with each value rounded to the nearest cent. It the normal model is not appropriate, give the median and range of the data with each value rounded to the nearest oenL 'rrIelvar-umlArI-I Elna xnnqnng 0f: ommupsvll\".f, Ettmu nmcss \f
Step by Step Solution
There are 3 Steps involved in it

Get step-by-step solutions from verified subject matter experts