

Question: Please answer those multiple choice questions. Thank you. 1) Supposed that you are interested in depicting the monthly sales per region over time of a
Please answer those multiple choice questions. Thank you.
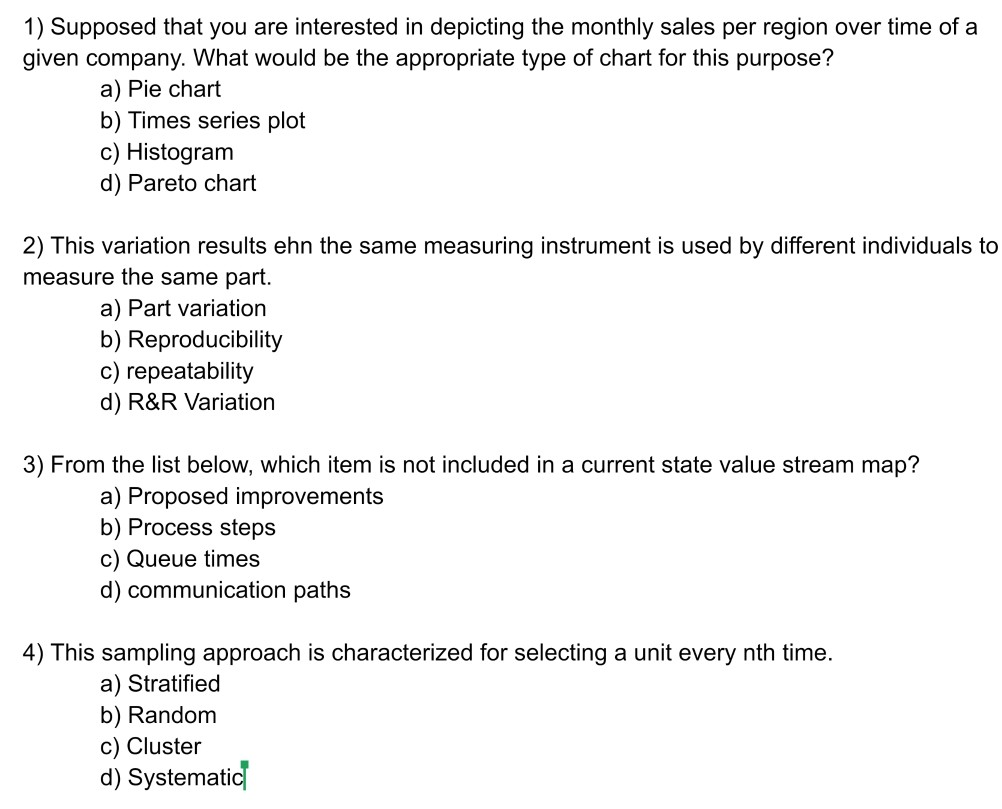
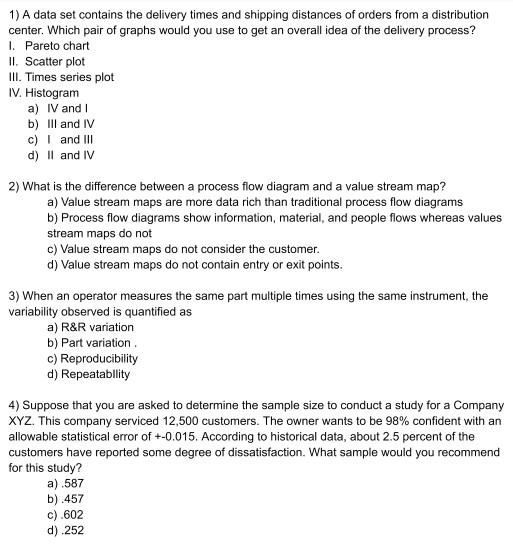
1) Supposed that you are interested in depicting the monthly sales per region over time of a given company. What would be the appropriate type of chart for this purpose? a) Pie chart b) Times series plot c) Histogram d) Pareto chart 2) This variation results ehn the same measuring instrument is used by different individuals to measure the same part. a) Part variation b) Reproducibility c) repeatability d) R&R Variation 3) From the list below, which item is not included in a current state value stream map? a) Proposed improvements b) Process steps c) Queue times d) communication paths 4) This sampling approach is characterized for selecting a unit every nth time. a) Stratified b) Random c) Cluster d) Systematic 1) A data set contains the delivery times and shipping distances of orders from a distribution center. Which pair of graphs would you use to get an overall idea of the delivery process? I. Pareto chart II. Scatter plot III. Times series plot IV. Histogram a) IV and b) III and IV c) I and III d) II and IV 2) What is the difference between a process flow diagram and a value stream map? a) Value stream maps are more data rich than traditional process flow diagrams b) Process flow diagrams show information, material, and people flows whereas values stream maps do not c) Value stream maps do not consider the customer. d) Value stream maps do not contain entry or exit points. 3) When an operator measures the same part multiple times using the same instrument, the variability observed is quantified as a) R&R variation b) Part variation c) Reproducibility d) Repeatabllity 4) Suppose that you are asked to determine the sample size to conduct a study for a Company XYZ. This company serviced 12,500 customers. The owner wants to be 98% confident with an allowable statistical error of +-0.015. According to historical data, about 2.5 perc of the customers have reported some degree of dissatisfaction. What sample would you recommend for this study? a).587 b).457 c) 602 d) 252Step by Step Solution
There are 3 Steps involved in it
1 Expert Approved Answer
Step: 1 Unlock

Question Has Been Solved by an Expert!
Get step-by-step solutions from verified subject matter experts
Step: 2 Unlock
Step: 3 Unlock