

Question: Please answer using Excel : Below i attach the data table for question 1 Defects Batch ScreenMotherboardCameraTouchpadKeyboard 1 42202 2 13001 3 21115 4 21020
Please answer using Excel :
Below i attach the data table for question 1
DefectsBatch
ScreenMotherboardCameraTouchpadKeyboard1422022130013211154210205121216032007321338100019010101010210113100112232121300301143001115121111620021170000118211121912300201010121010122210003231321224001022521114
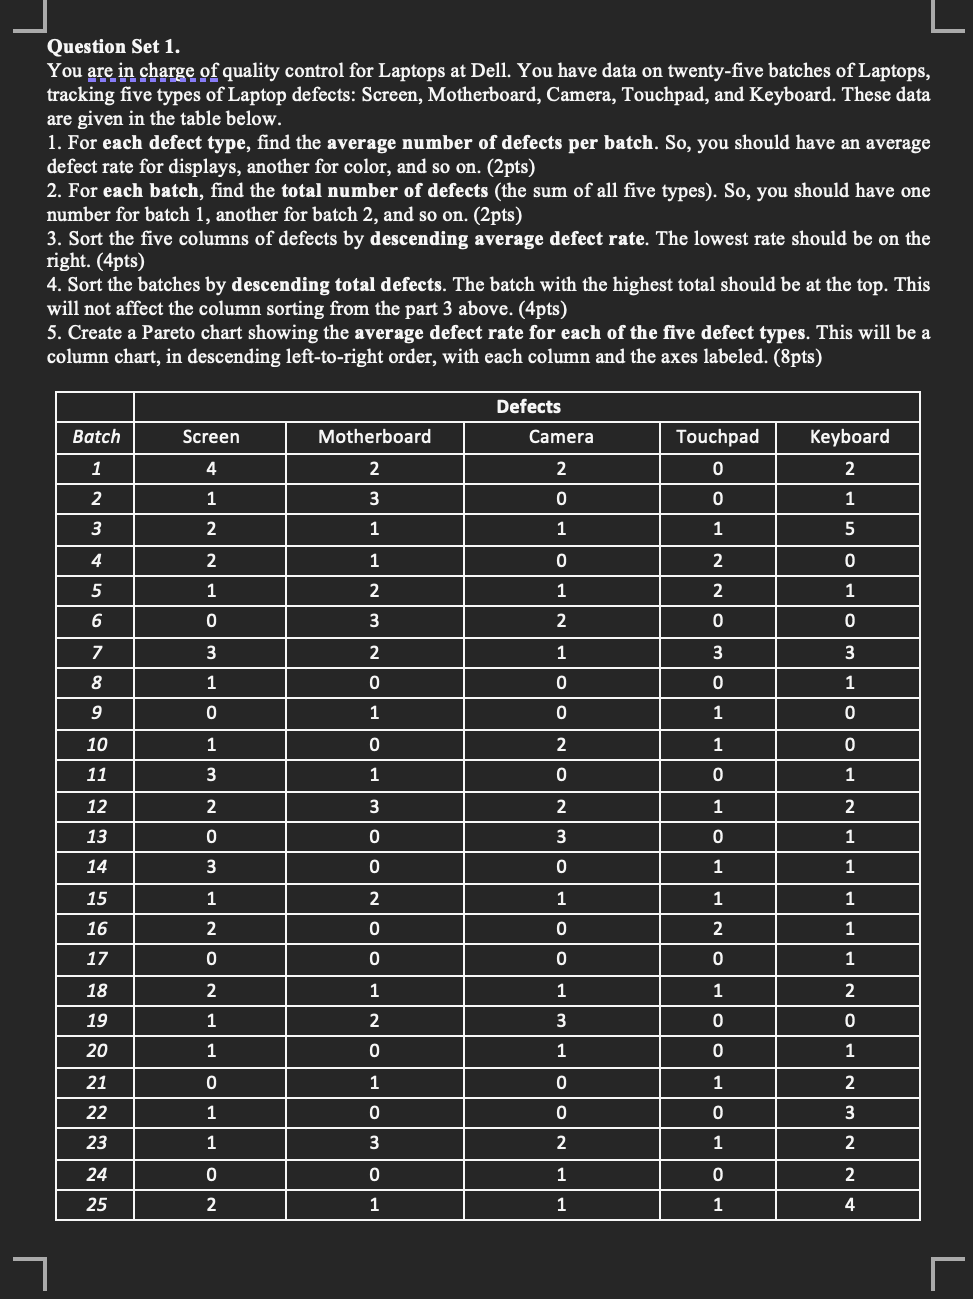
Question Set 1. You are in charge of quality control for Laptops at Dell. You have data on twenty-five batches of Laptops, tracking five types of Laptop defects: Screen, Motherboard, Camera, Touchpad, and Keyboard. These data are given in the table below. 1. For each defect type, find the average number of defects per batch. So, you should have an average defect rate for displays, another for color, and so on. (2pts) 2. For each batch, find the total number of defects (the sum of all five types). So, you should have one number for batch 1 , another for batch 2 , and so on. (2pts) 3. Sort the five columns of defects by descending average defect rate. The lowest rate should be on the right. (4pts) 4. Sort the batches by descending total defects. The batch with the highest total should be at the top. This will not affect the column sorting from the part 3 above. (4pts) 5. Create a Pareto chart showing the average defect rate for each of the five defect types. This will be a column chart, in descending left-to-right order, with each column and the axes labeled. (8pts)
Step by Step Solution
There are 3 Steps involved in it

Get step-by-step solutions from verified subject matter experts