

Question: please answer using excel. data is provided in second photo a. Take the unformatted data and in a new worksheet format the data in a
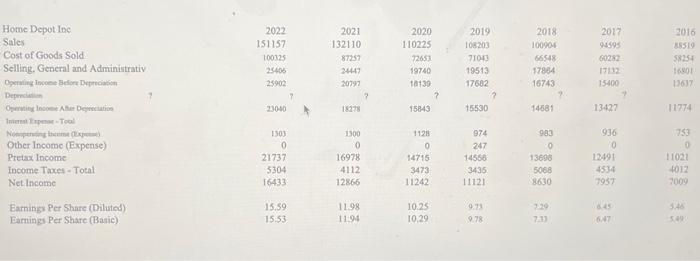
a. Take the unformatted data and in a new worksheet format the data in a single format. The data should have a centered header identifying the firm and the data and should have the years in a row which is colored green. b. Copy Sales, EBITDA, EBIT and Net Income into another worksheet which has a header which identifies firm, Profitability Analysis and years. c. Calculate the operating margins for EBITDA and EBIT and the net profit margin for each year. d. Create spark line charts for all operating and net profit margins. Make sure that the spark lines show the trend-you want more recent data on the right of the chart and oldest data on the left of the chart. e. Graph Sales and Net Income is the same graph vs Years. a. Take the unformatted data and in a new worksheet format the data in a single format. The data should have a centered header identifying the firm and the data and should have the years in a row which is colored green. b. Copy Sales, EBITDA, EBIT and Net Income into another worksheet which has a header which identifies firm, Profitability Analysis and years. c. Calculate the operating margins for EBITDA and EBIT and the net profit margin for each year. d. Create spark line charts for all operating and net profit margins. Make sure that the spark lines show the trend-you want more recent data on the right of the chart and oldest data on the left of the chart. e. Graph Sales and Net Income is the same graph vs Years
Step by Step Solution
There are 3 Steps involved in it

Get step-by-step solutions from verified subject matter experts