

Question: 2. Figure 1 shows three reactors connected by pipes the volumetric flow rate is tabulated in table 1: Q13C1 Q33C3 Q1 3 1 Q23C2
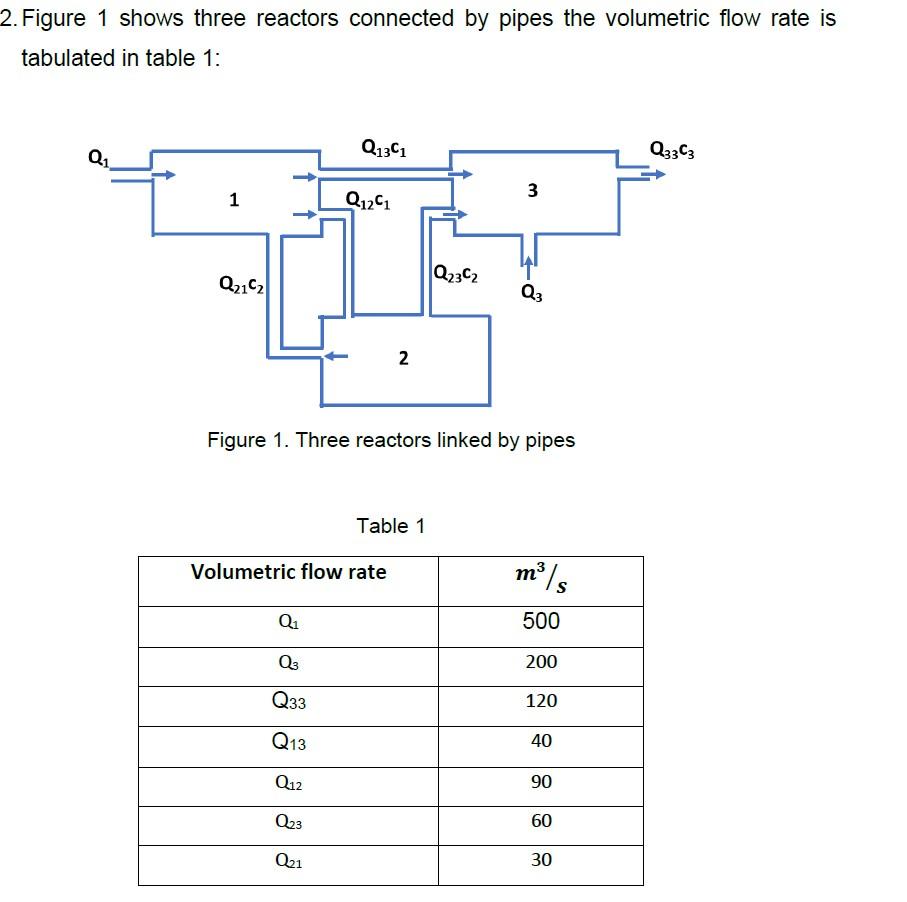
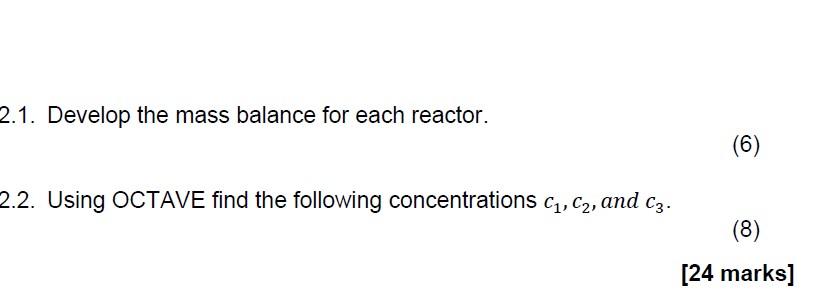
2. Figure 1 shows three reactors connected by pipes the volumetric flow rate is tabulated in table 1: Q13C1 Q33C3 Q1 3 1 Q23C2 Q3 Figure 1. Three reactors linked by pipes Table 1 Volumetric flow rate Q1 500 Q3 200 Q33 120 Q13 40 Q12 90 Q23 60 Q21 30 2.1. Develop the mass balance for each reactor. (6) 2.2. Using OCTAVE find the following concentrations c,, C2, and c3. (8) [24 marks]
Step by Step Solution
★★★★★
3.47 Rating (150 Votes )
There are 3 Steps involved in it
1 Expert Approved Answer
Step: 1 Unlock

Question Has Been Solved by an Expert!
Get step-by-step solutions from verified subject matter experts
Step: 2 Unlock
Step: 3 Unlock