

Question: Please answer using Python Exercise 3.2: Curve plotting Although the plot function is designed primarily for plotting standard xy graphs, it can be adapted for
Please answer using Python
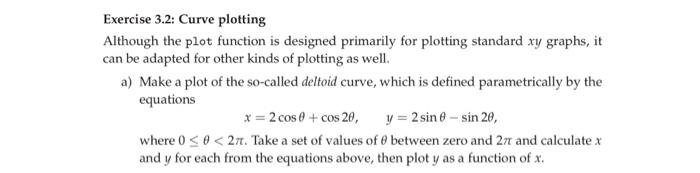
Exercise 3.2: Curve plotting Although the plot function is designed primarily for plotting standard xy graphs, it can be adapted for other kinds of plotting as well. a) Make a plot of the so-called deltoid curve, which is defined parametrically by the equations x = 2 cos 0 + cos 20, y = 2 sin 8-sin 20, where 0
Step by Step Solution
There are 3 Steps involved in it
1 Expert Approved Answer
Step: 1 Unlock

Question Has Been Solved by an Expert!
Get step-by-step solutions from verified subject matter experts
Step: 2 Unlock
Step: 3 Unlock