

Question: please answer using spreadsheet format included and numbers 1-5! Thank you! The information is the first picture Tires for You, Ine. (TFY), founded in 1987,
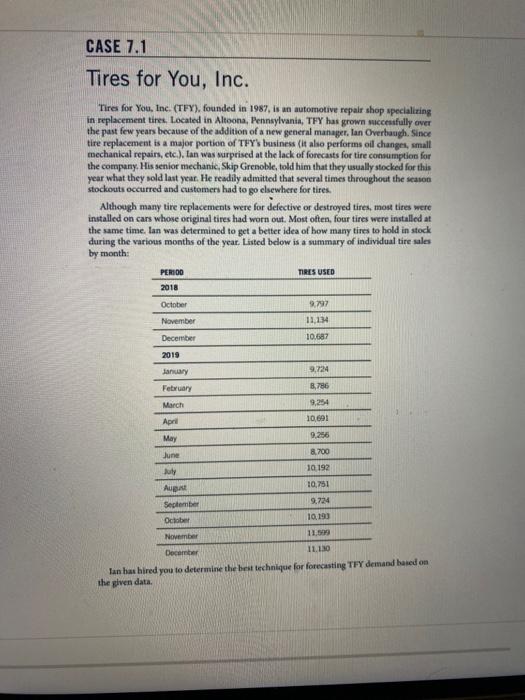
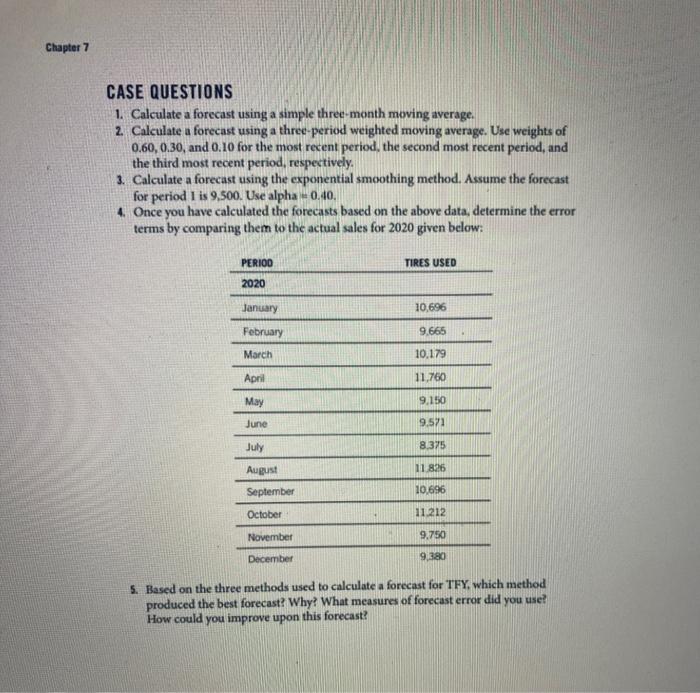
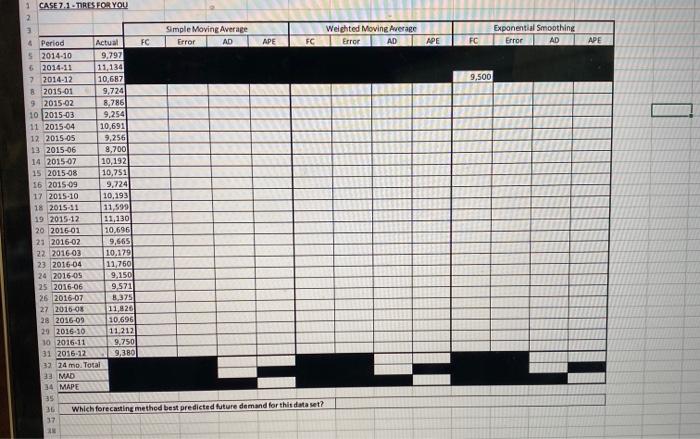
Tires for You, Ine. (TFY), founded in 1987, is an automotive repalr shop specialiting in replacement tires. Located in Altoona, Pennsylvania, TFY has grown micerstiully over the past few years because of the addition of a new general manager, lan Overhaugh. Since tire replacement is a major portion of THY's business (it also performs oil changre, small mechanical repairs, ctc.). Lan was wirprised at the lack of forecasts for tire consumption for the company. His senior mechanic, Skip Grenoble, told him that they usually stocked for this year what they sold last year. He readily admitted that several times throughout the season stockouts occurred and customers had to go elsewhere for tires. Although many tire replacements were for defective or destroyed tires, most tires were installed on cars whose original tires had worn out. Most often, four tires were installed at the same time. lan was determined to get a better idea of bow many tires to hold in stock during the various months of the year. Listed below is a summary of individual tire sales by month: Ian has bired you to determine the beat technique for forecasting TFY demand baied oa the given data. CASE QUESTIONS 1. Calculate a forecast using a simple three-month moving average. 2. Calculate a forecast using a three-period weighted moving average. Use weights of 0.60,0.30, and 0.10 for the most recent period, the second most recent period, and the third most recent period, respectively. 3. Calculate a forecast using the exponential smoothing method. Assume the forecast for period I is 9,500 . Use alpha =0.40. 4. Once you have calculated the forecasts based on the above data, determine the error terms by comparing them to the actual sales for 2020 given below: 5. Based on the three methods used to calculate a forecast for TFY, which method produced the best forecast? Why? What measures of forecast error did you use? How could you improve upon this forecast? CASE7.1 - TREESOGYOU Which forecating method best predicted future demand for this data set? Tires for You, Ine. (TFY), founded in 1987, is an automotive repalr shop specialiting in replacement tires. Located in Altoona, Pennsylvania, TFY has grown micerstiully over the past few years because of the addition of a new general manager, lan Overhaugh. Since tire replacement is a major portion of THY's business (it also performs oil changre, small mechanical repairs, ctc.). Lan was wirprised at the lack of forecasts for tire consumption for the company. His senior mechanic, Skip Grenoble, told him that they usually stocked for this year what they sold last year. He readily admitted that several times throughout the season stockouts occurred and customers had to go elsewhere for tires. Although many tire replacements were for defective or destroyed tires, most tires were installed on cars whose original tires had worn out. Most often, four tires were installed at the same time. lan was determined to get a better idea of bow many tires to hold in stock during the various months of the year. Listed below is a summary of individual tire sales by month: Ian has bired you to determine the beat technique for forecasting TFY demand baied oa the given data. CASE QUESTIONS 1. Calculate a forecast using a simple three-month moving average. 2. Calculate a forecast using a three-period weighted moving average. Use weights of 0.60,0.30, and 0.10 for the most recent period, the second most recent period, and the third most recent period, respectively. 3. Calculate a forecast using the exponential smoothing method. Assume the forecast for period I is 9,500 . Use alpha =0.40. 4. Once you have calculated the forecasts based on the above data, determine the error terms by comparing them to the actual sales for 2020 given below: 5. Based on the three methods used to calculate a forecast for TFY, which method produced the best forecast? Why? What measures of forecast error did you use? How could you improve upon this forecast? CASE7.1 - TREESOGYOU Which forecating method best predicted future demand for this data set
Step by Step Solution
There are 3 Steps involved in it

Get step-by-step solutions from verified subject matter experts