

Question: Please answer using the table below The Lorenz Curve The table below shows the income distribution for the U.S. and India Income Quintile Percentage of
Please answer using the table below
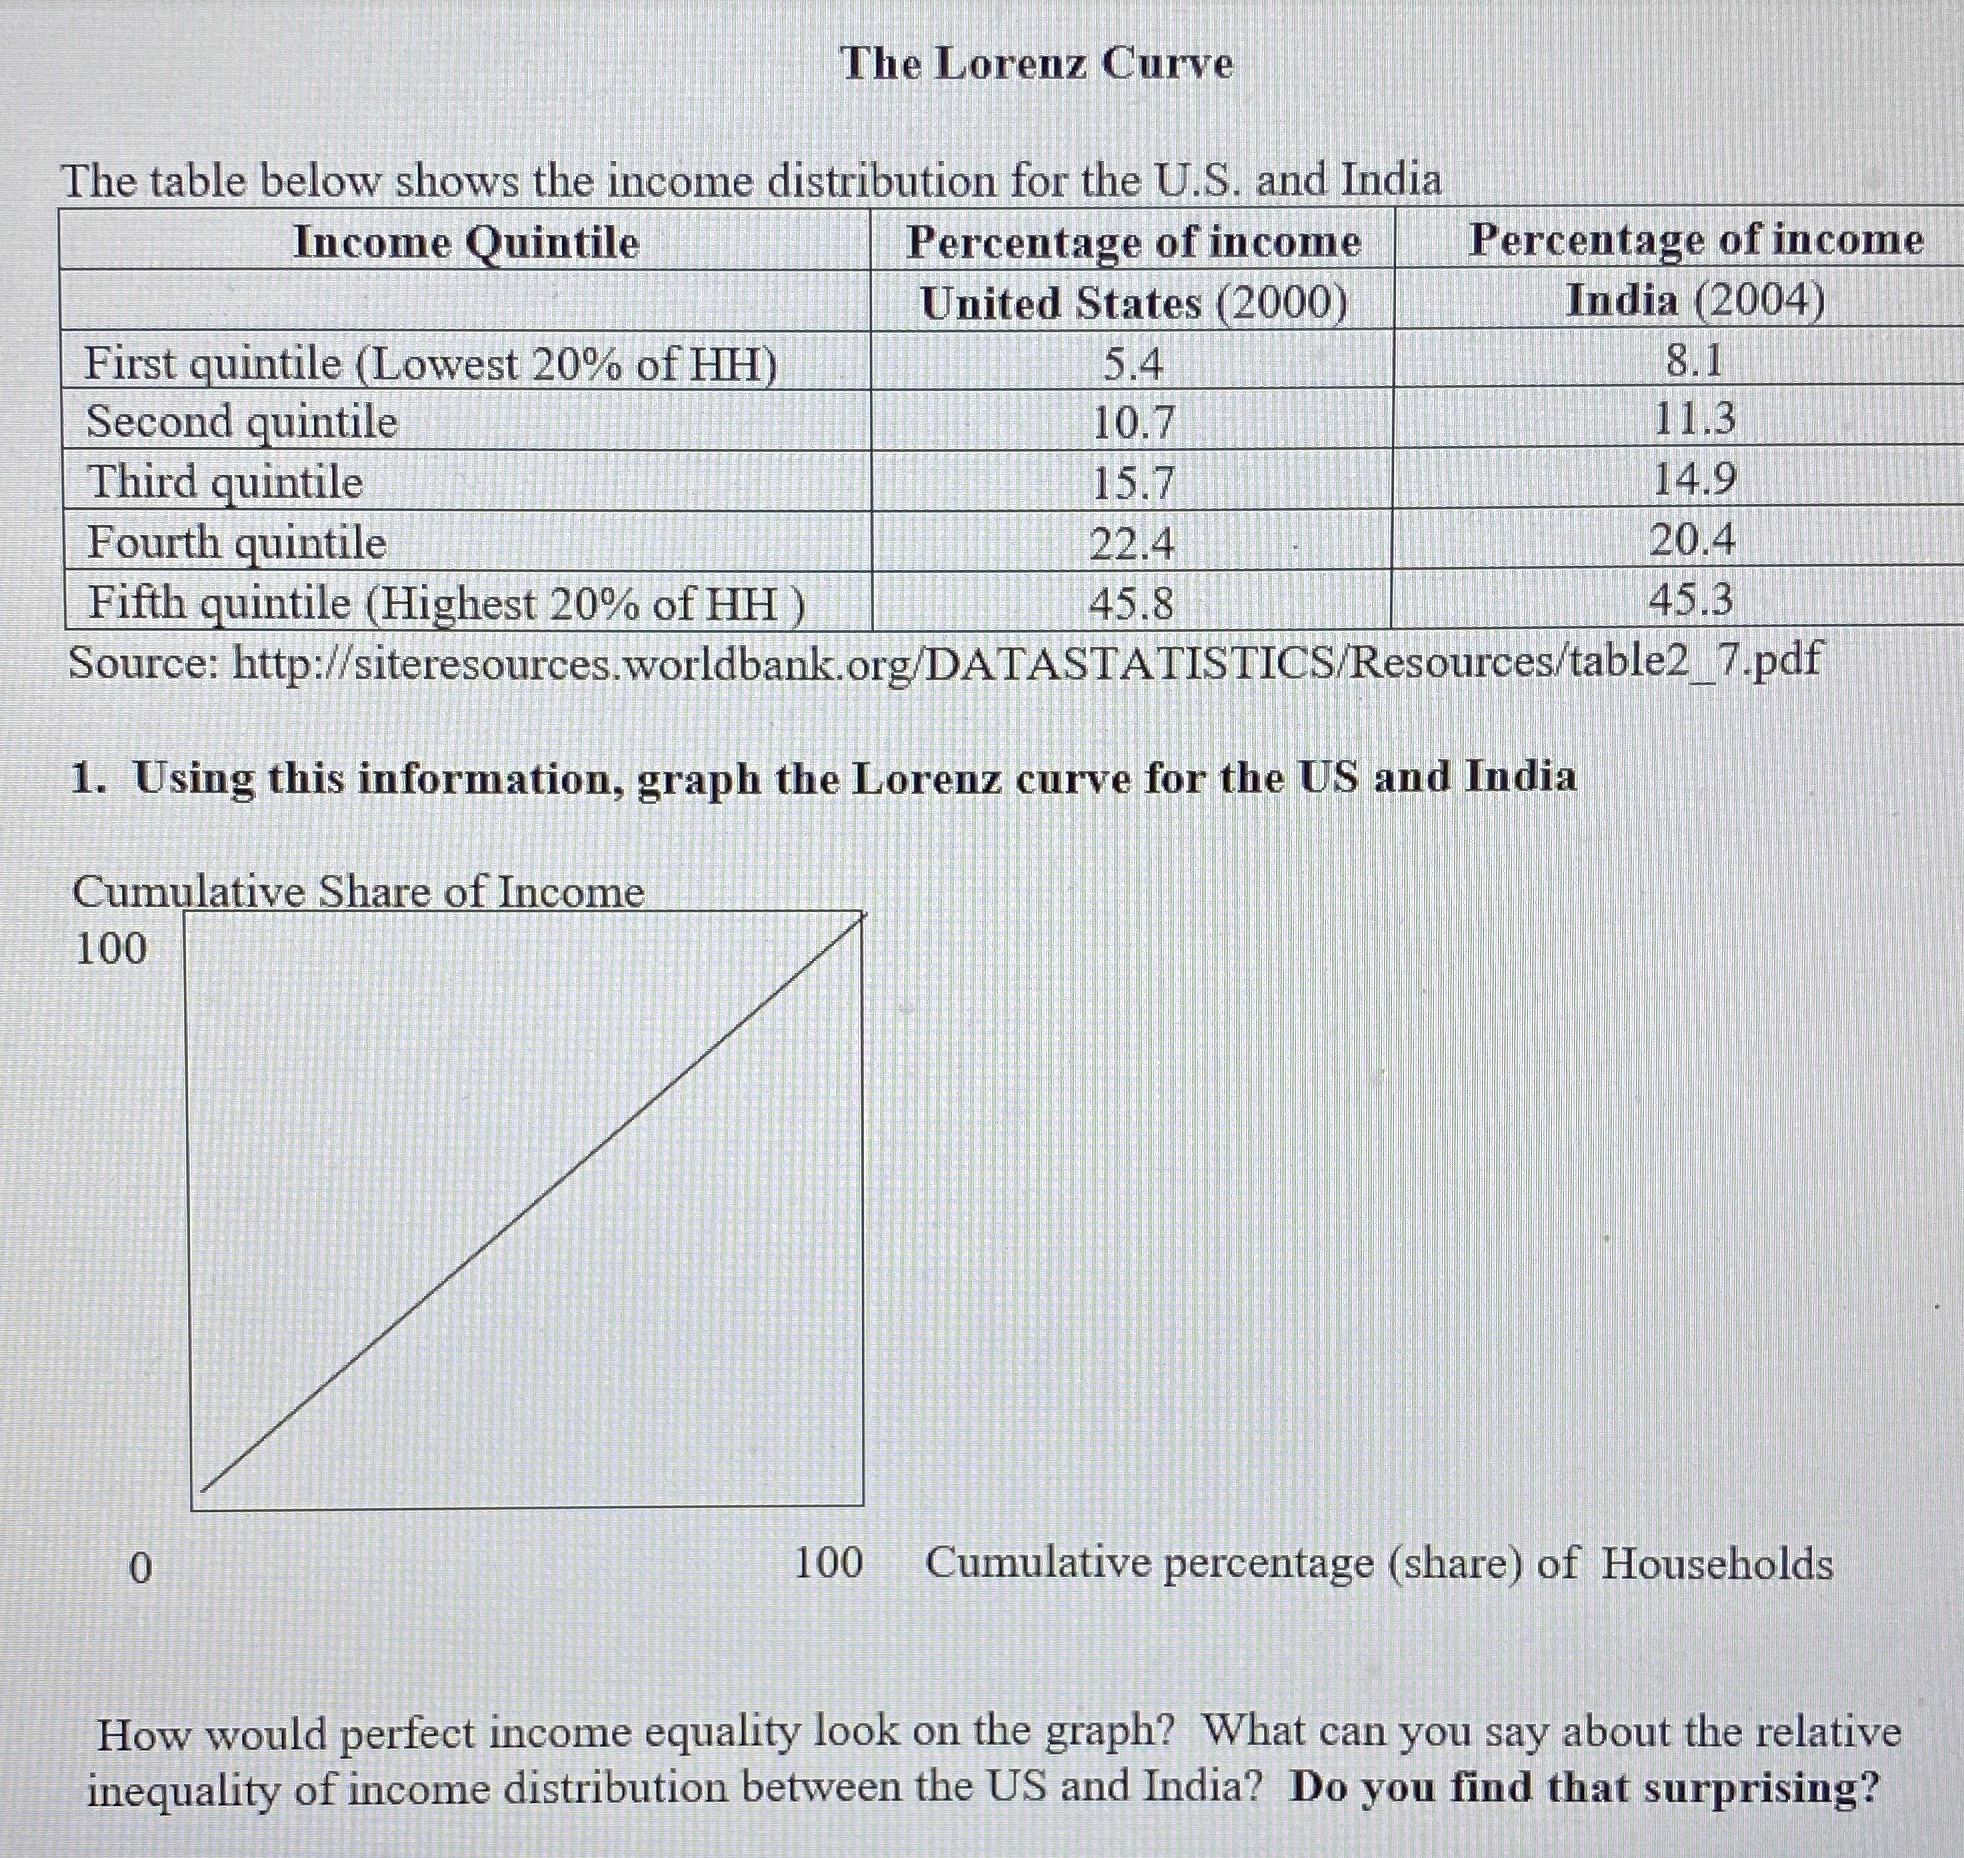
The Lorenz Curve The table below shows the income distribution for the U.S. and India Income Quintile Percentage of income Percentage of income United States (2000) India (2004) First quintile (Lowest 20% of HH) 5.4 8.1 Second quintile 10.7 11.3 Third quintile 15.7 14.9 Fourth quintile 22.4 20.4 Fifth quintile (Highest 20% of HH ) 45.8 45.3 Source: http://siteresources.worldbank.org/DATASTATISTICS/Resources/table2 7.pdf 1. Using this information, graph the Lorenz curve for the US and India Cumulative Share of Income 100 0 100 Cumulative percentage (share) of Households How would perfect income equality look on the graph? What can you say about the relative inequality of income distribution between the US and India? Do you find that surprising
Step by Step Solution
There are 3 Steps involved in it

Get step-by-step solutions from verified subject matter experts