

The following table shows the income distribution by quintile for the UK in 1991, for various definitions
Question:
The following table shows the income distribution by quintile for the UK in 1991, for various definitions of income:
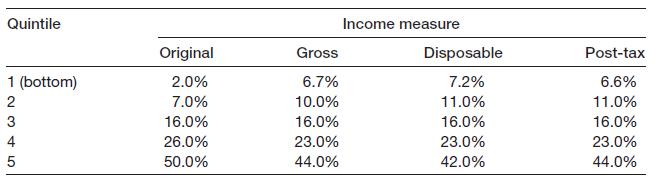
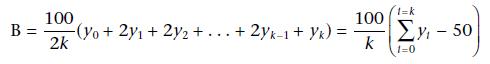
(a) Use equation (10.27) to calculate the Gini coefficient for each of the four categories of income.
(b) For the ‘original income’ category, draw a smooth Lorenz curve on a piece of gridded paper and calculate the Gini coefficient using the method of counting squares. How does your answer compare to that for part (a)?
(10.27)
Fantastic news! We've Found the answer you've been seeking!
Step by Step Answer:
To calculate the ...View the full answer

Answered By
Aketch Cindy Sunday
I am a certified tutor with over two years of experience tutoring . I have a passion for helping students learn and grow, and I firmly believe that every student has the potential to be successful. I have a wide range of experience working with students of all ages and abilities, and I am confident that I can help students succeed in school.
I have experience working with students who have a wide range of abilities. I have also worked with gifted and talented students, and I am familiar with a variety of enrichment and acceleration strategies.
I am a patient and supportive tutor who is dedicated to helping my students reach their full potential. Thank you for your time and consideration.
0 Reviews
10+ Question Solved
Related Book For 
Statistics For Economics Accounting And Business Studies
ISBN: 978027368308
4th Edition
Authors: Michael Barrow
Question Posted:
