

Question: Please answer with explanation Below is information regarding Paul's Surfboard Inc. Complete the table and do the following: a. On a large graph, plot the
Please answer with explanation
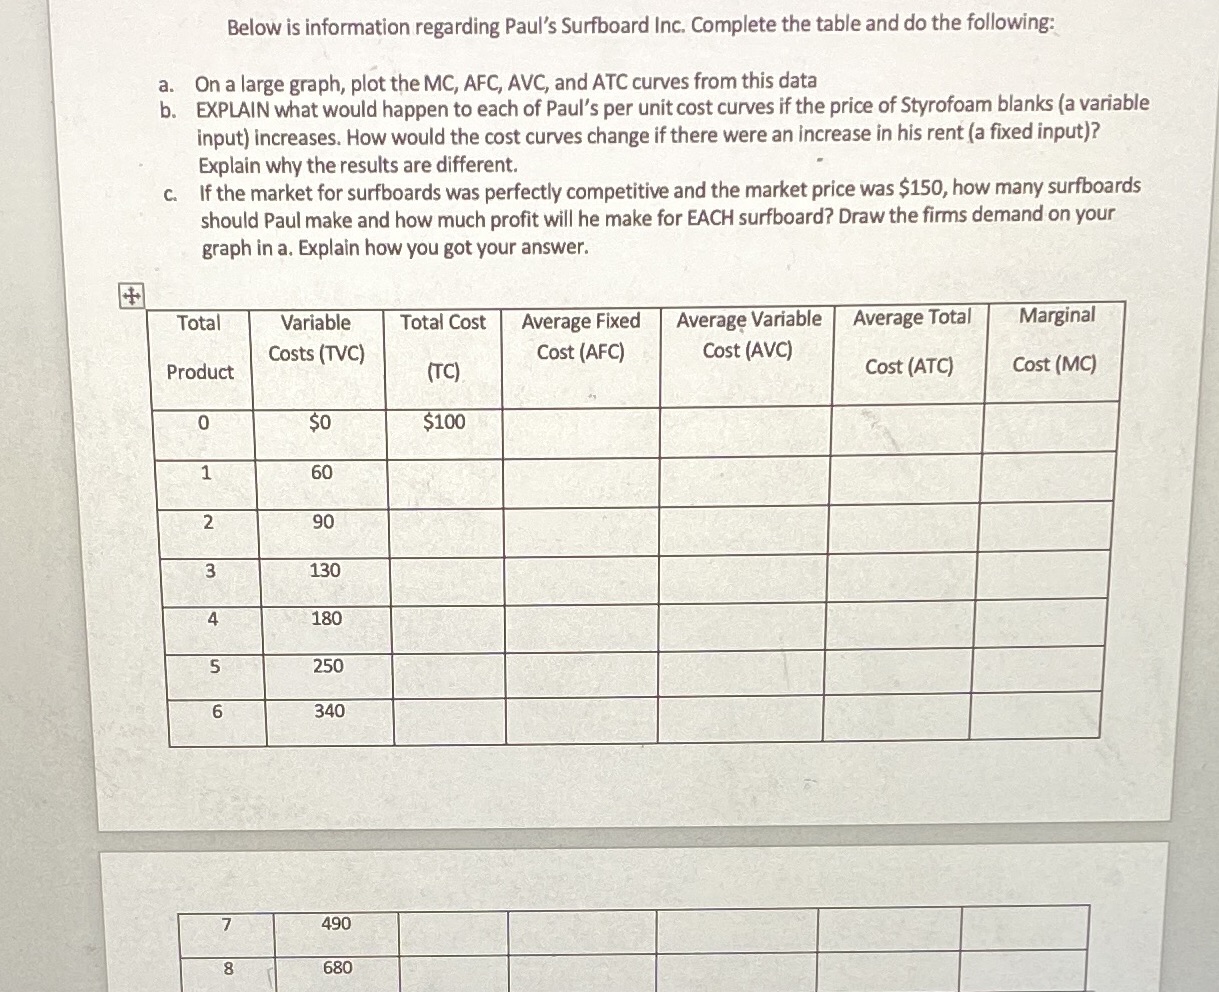
Below is information regarding Paul's Surfboard Inc. Complete the table and do the following: a. On a large graph, plot the MC, AFC, AVC, and ATC curves from this data b. EXPLAIN what would happen to each of Paul's per unit cost curves if the price of Styrofoam blanks (a variable input) increases. How would the cost curves change if there were an increase in his rent (a fixed input)? Explain why the results are different. C. If the market for surfboards was perfectly competitive and the market price was $150, how many surfboards should Paul make and how much profit will he make for EACH surfboard? Draw the firms demand on your graph in a. Explain how you got your answer. Total Variable Total Cost Average Fixed Average Variable Average Total Marginal Costs (TVC) Cost (AFC) Cost (AVC) Product (TC) Cost (ATC) Cost (MC) 0 SO $100 1 60 2 90 3 130 4 180 5 250 6 340 490 8 680
Step by Step Solution
There are 3 Steps involved in it

Get step-by-step solutions from verified subject matter experts