

Question: Please answer with the actual matlab code. A proposed network of irrigation canals is described in the accompanying diagram. At peak demand, the flows at
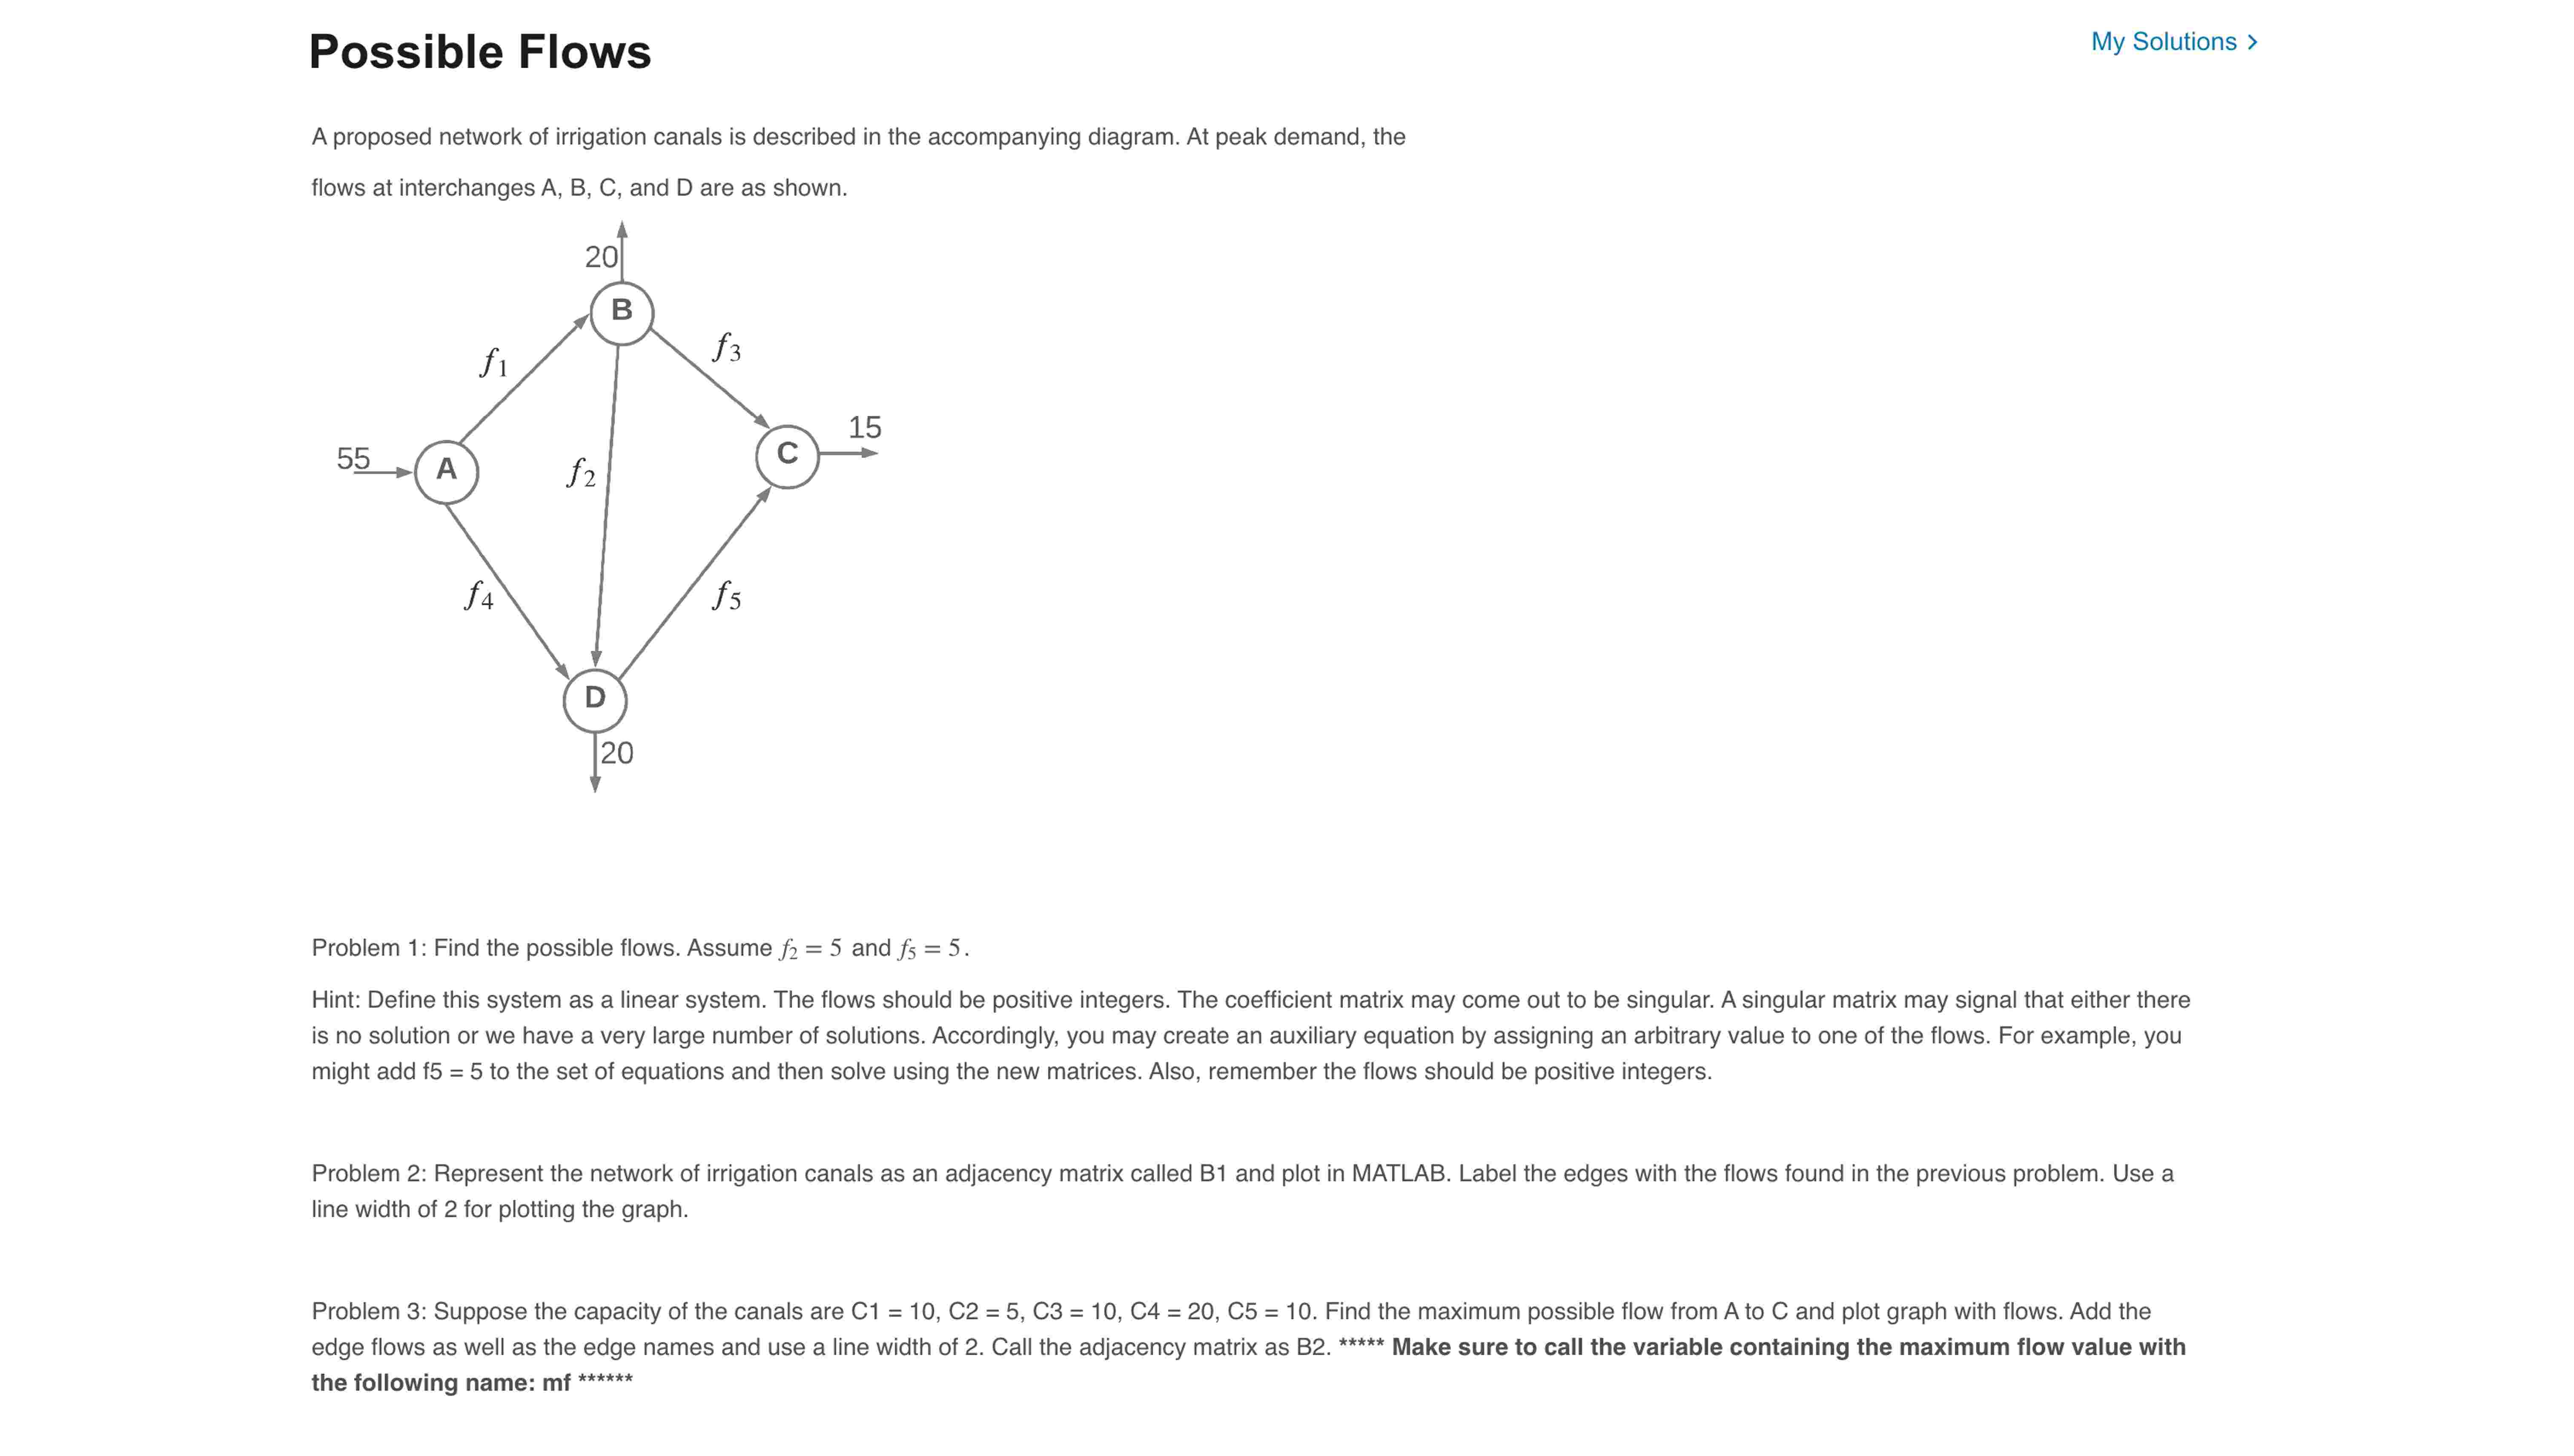
Please answer with the actual matlab code. A proposed network of irrigation canals is described in the accompanying diagram. At peak demand, the flows at interchanges A B C and D are as shown.
Problem : Find the possible flows. Assume f and f
Hint: Define this system as a linear system. The flows should be positive integers. The coefficient matrix may come out to be singular. A singular matrix may signal that either there is no solution or we have a very large number of solutions. Accordingly, you may create an auxiliary equation by assigning an arbitrary value to one of the flows. For example, you might add f to the set of equations and then solve using the new matrices. Also, remember the flows should be positive integers.
Problem : Represent the network of irrigation canals as an adjacency matrix called B and plot in MATLAB. Label the edges with the flows found in the previous problem. Use a line width of for plotting the graph.
Problem : Suppose the capacity of the canals are C C C C C Find the maximum possible flow from A to C and plot graph with flows. Add the edge flows as well as the edge names and use a line width of Call the adjacency matrix as B Make sure to call the variable containing the maximum flow value with the following name: mf
Step by Step Solution
There are 3 Steps involved in it
1 Expert Approved Answer
Step: 1 Unlock

Question Has Been Solved by an Expert!
Get step-by-step solutions from verified subject matter experts
Step: 2 Unlock
Step: 3 Unlock