

Question: please anwser every question posted in the pic. do not anwser if you are just going to anwser one. i need all to be anwsered,
please anwser every question posted in the pic. do not anwser if you are just going to anwser one. i need all to be anwsered, thank you. and please type out your anwser 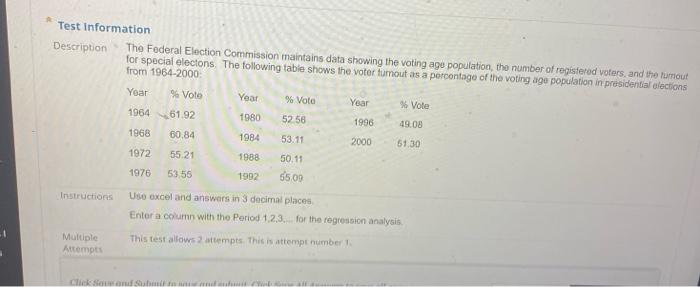
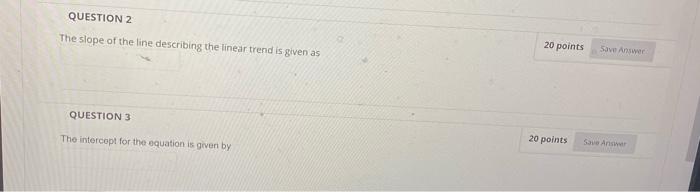
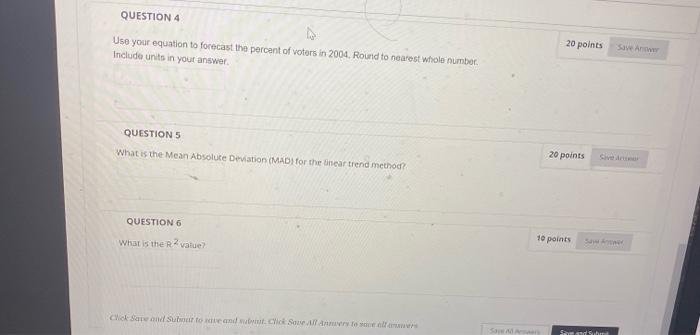
Test Information Description The Federal Election Commission maintains data showing the voting age population, the number of registered voters, and the tumout for special electons. The following table shows the voter Zumout as a percentage of the voting age population in presidential elections from 1984-2000 Year % Vote Year % Voto Year % Vote 1964 61.92 1980 52 56 1996 49.08 1968 60.84 1984 53.11 2000 51,30 1972 55.21 1988 1976 50.11 5509 53 55 1992 Instructions Uso excel and answers in 3 decimal places Enter a column with the Period 1,2,3, for the regression analysis Multiple Attempts This test allows attempts. This is attempt number 1 QUESTION 2 The slope of the line describing the lineartrend is given as 20 points Suve Answer QUESTION 3 The intercept for the equation is given by 20 points Save Ant QUESTION 4 Use your equation to forecast the percent of voters in 2004. Round to nearest whole number Include units in your answer 20 points Save A QUESTION 5 What is the Mean Absolute Deviation (MAD) for the lineartrend method 20 points QUESTION 6 What is the R2 vate? 10 points Click Sand Sub to me and went Chic Soul Anwar SAS
Step by Step Solution
There are 3 Steps involved in it
1 Expert Approved Answer
Step: 1 Unlock

Question Has Been Solved by an Expert!
Get step-by-step solutions from verified subject matter experts
Step: 2 Unlock
Step: 3 Unlock