

Question: please assist me in understanding how to solve this Exercise 14-31 Algo 125% View Zoom Add Category Insert Table Chart + Property_Taxes Sheet2 The accompanying
please assist me in understanding how to solve this
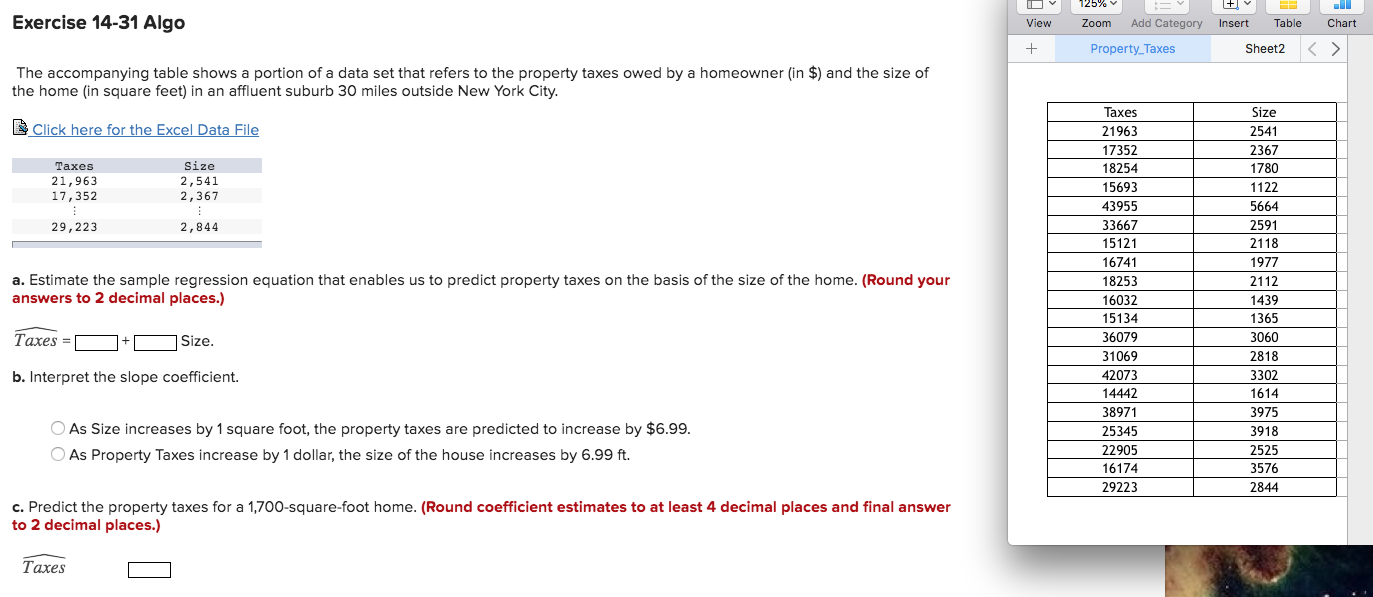
Exercise 14-31 Algo 125% View Zoom Add Category Insert Table Chart + Property_Taxes Sheet2 The accompanying table shows a portion of a data set that refers to the property taxes owed by a homeowner (in $) and the size of the home (in square feet) in an affluent suburb 30 miles outside New York City. Click here for the Excel Data File Taxes Size 21963 2541 Taxes Size 17352 2367 21,963 2, 541 18254 1780 17 ,352 2,367 15693 1122 43955 29,223 5664 2, 844 33667 259 15121 2118 a. Estimate the sample regression equation that enables us to predict property taxes on the basis of the size of the home. (Round your 16741 1977 answers to 2 decimal places.) 18253 2112 16032 1439 Taxes =[ 15134 1365 7 Size. 36079 3060 31069 b. Interpret the slope coefficient. 2818 42073 330 14442 1614 O As Size increases by 1 square foot, the property taxes are predicted to increase by $6.99. 38971 3975 25345 3918 O As Property Taxes increase by 1 dollar, the size of the house increases by 6.99 ft. 22905 2525 16174 3576 29223 2844 to 2 decimal places.) c. Predict the property taxes for a 1,700-square-foot home. (Round coefficient estimates to at least 4 decimal places and final answer Taxes
Step by Step Solution
There are 3 Steps involved in it

Get step-by-step solutions from verified subject matter experts