

Question: please assist with question #1 link to the spreadsheet: https://docs.google.com/spreadsheets/d/1vfgfAJU5abNg5FGU9dBt__NI_6icWASCby23AafKi6g/edit?usp=sharing Wk 6 - Practice: Wk 6 Exercises [due Day 5] i Saved Help Save &
please assist with question #1
link to the spreadsheet: https://docs.google.com/spreadsheets/d/1vfgfAJU5abNg5FGU9dBt__NI_6icWASCby23AafKi6g/edit?usp=sharing
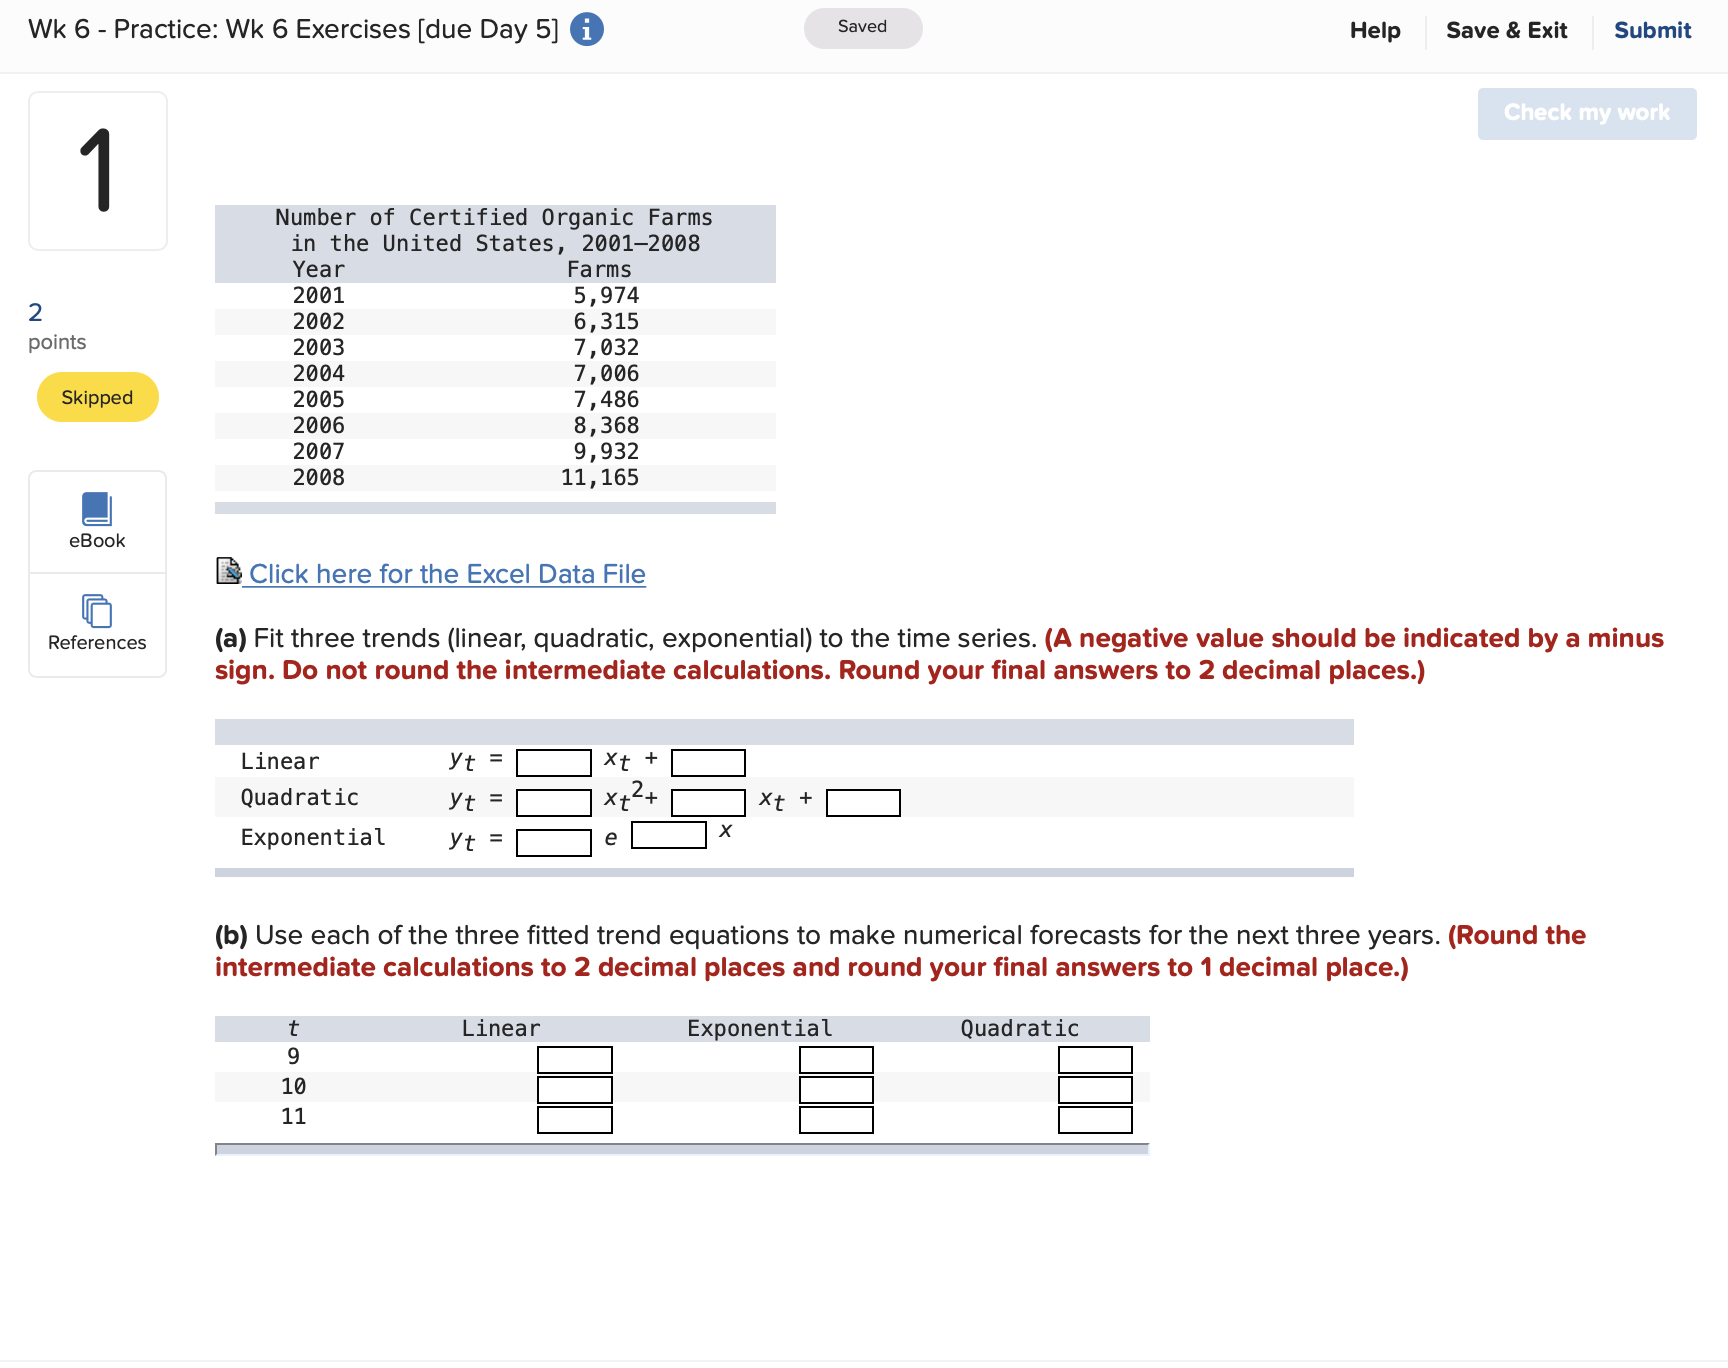
Wk 6 - Practice: Wk 6 Exercises [due Day 5] i Saved Help Save & Exit Submit Check my work Number of Certified Organic Farms in the United States, 2001-2008 Year Farms 2 2001 5,974 2002 6, 315 points 2003 7, 032 2004 7, 006 Skipped 2005 7, 486 2006 8, 368 2007 9,932 2008 11, 165 eBook Click here for the Excel Data File References (a) Fit three trends (linear, quadratic, exponential) to the time series. (A negative value should be indicated by a minus sign. Do not round the intermediate calculations. Round your final answers to 2 decimal places.) Linear yt = y t = Xt + Quadratic x t 2 + Xt + Exponential yt (b) Use each of the three fitted trend equations to make numerical forecasts for the next three years. (Round the intermediate calculations to 2 decimal places and round your final answers to 1 decimal place.) t Linear Exponential Quadratic 9 10 11
Step by Step Solution
There are 3 Steps involved in it

Get step-by-step solutions from verified subject matter experts